The strongest hurricanes in recorded history—see how Michael stacks up
From the Atlantic to the Pacific, these killer storms have packed the most wallop in recorded history. Here's what you need to know.
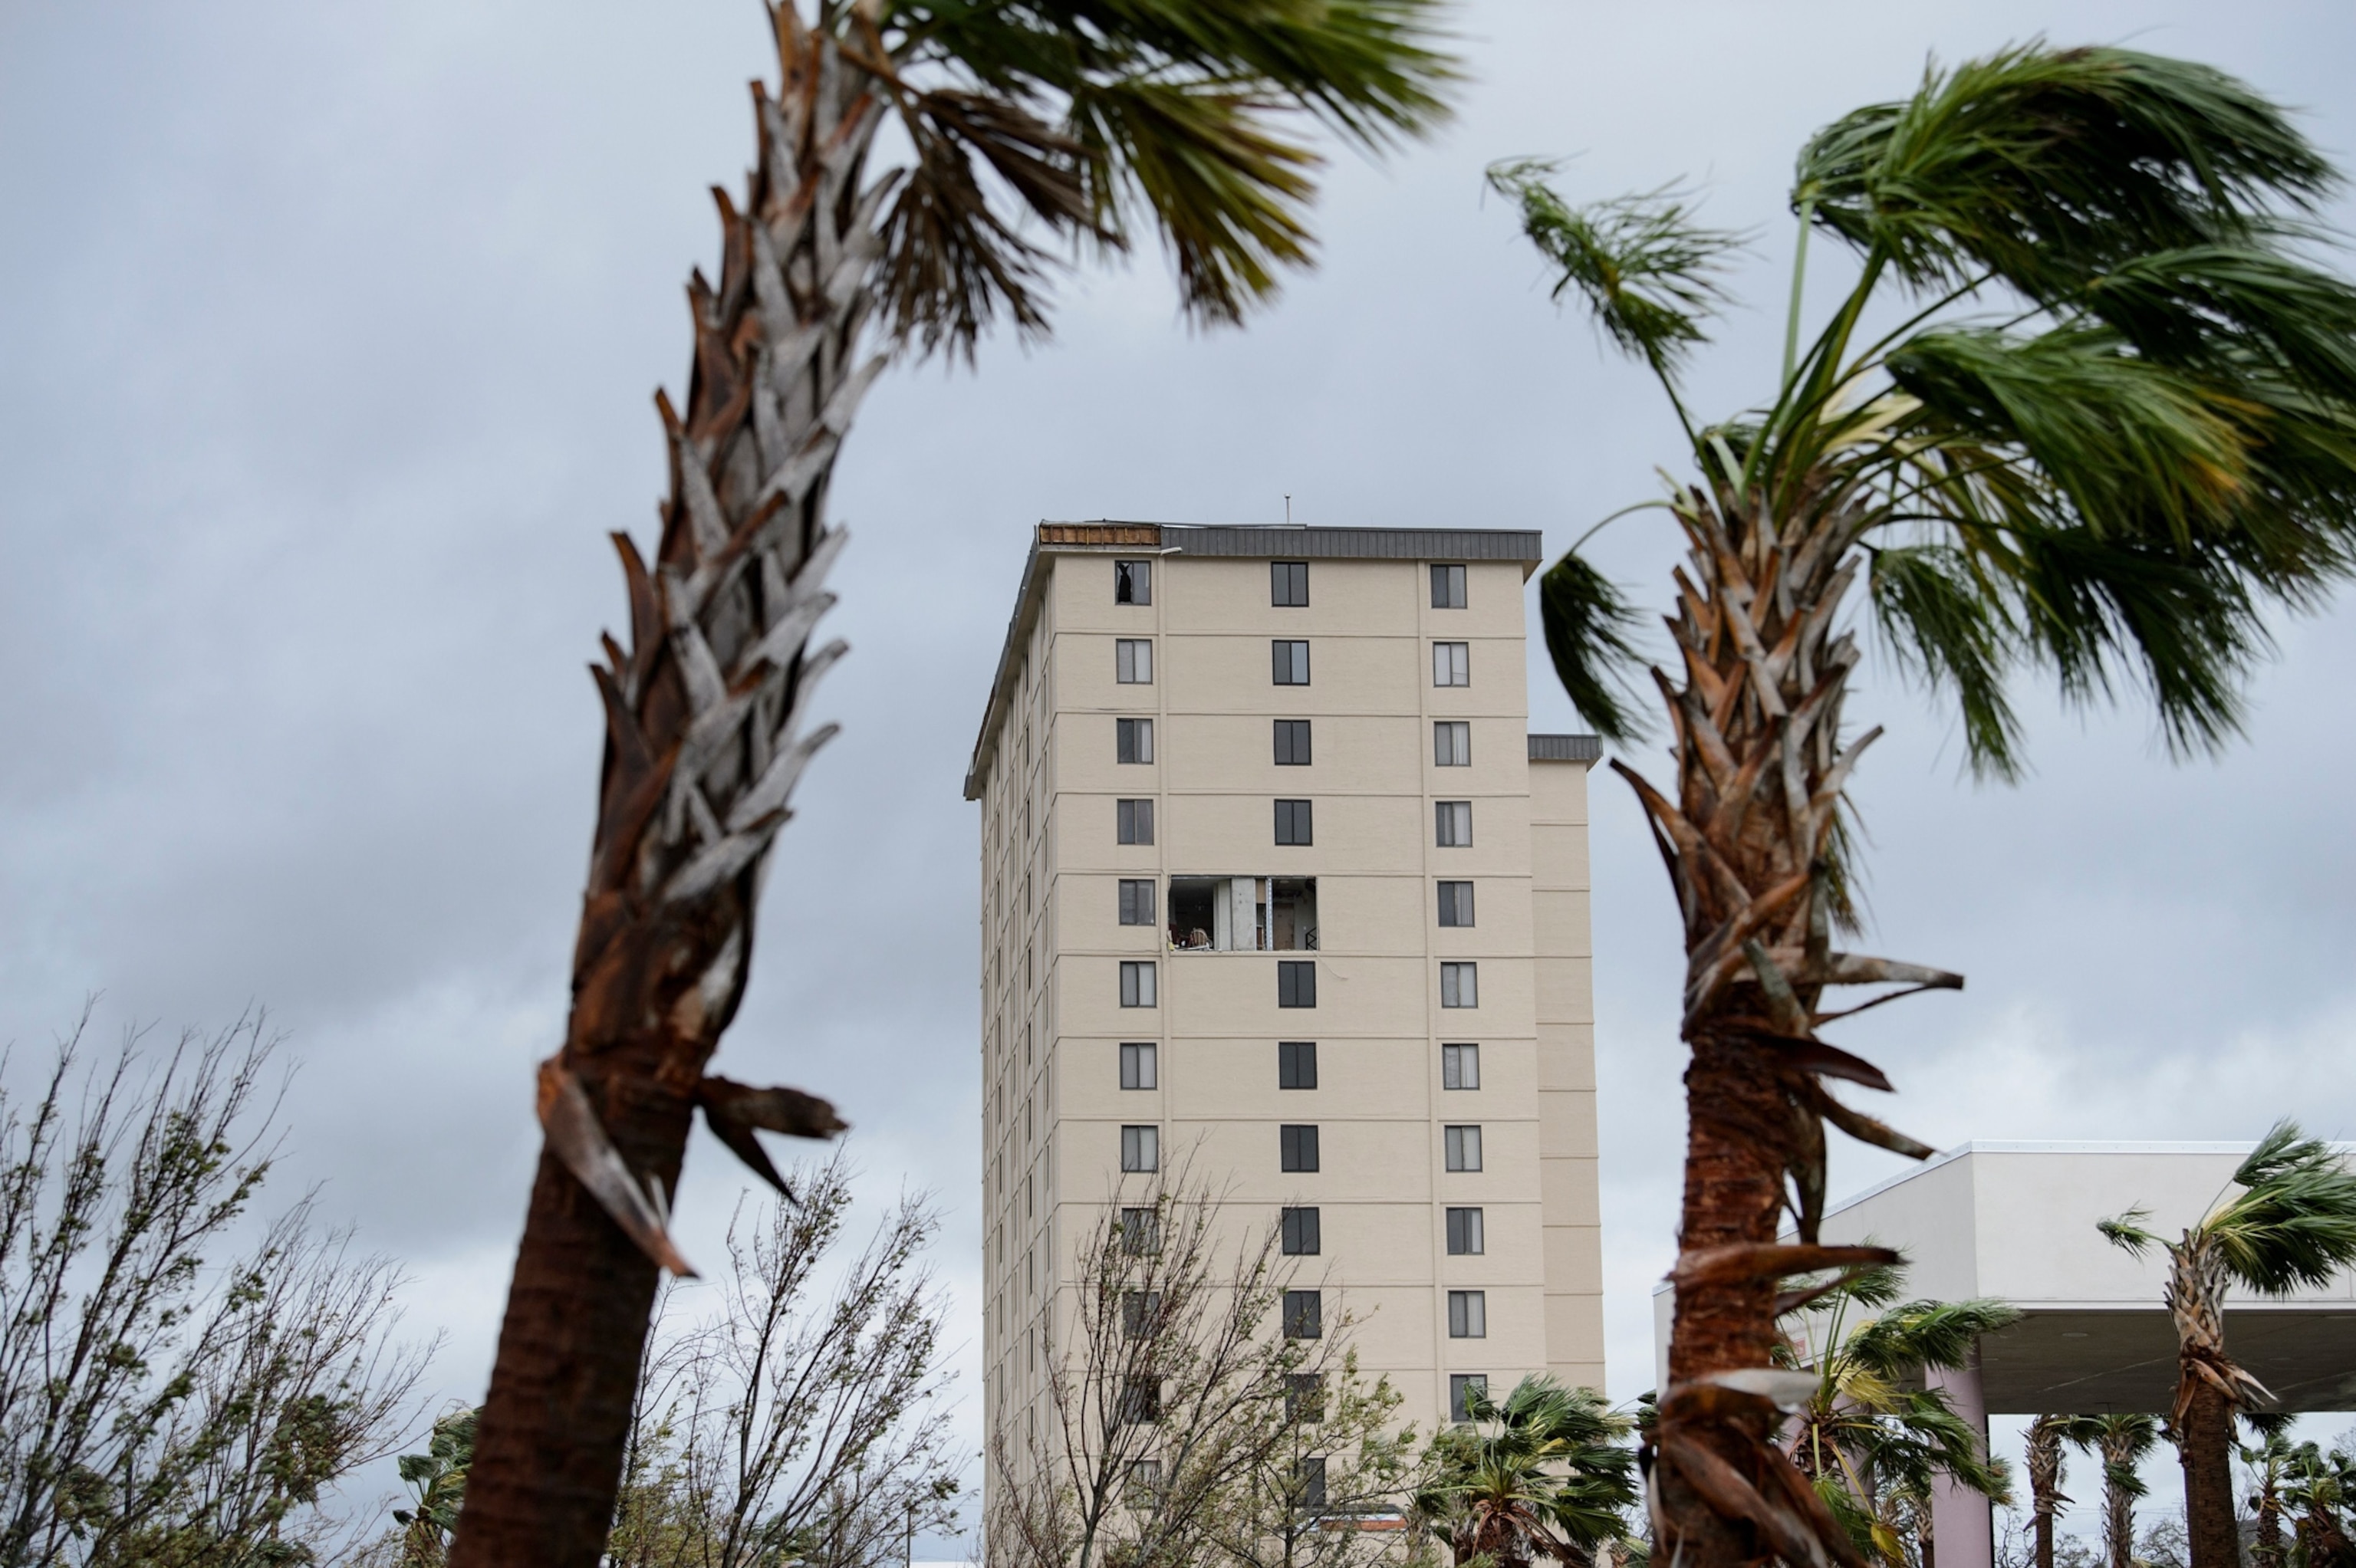
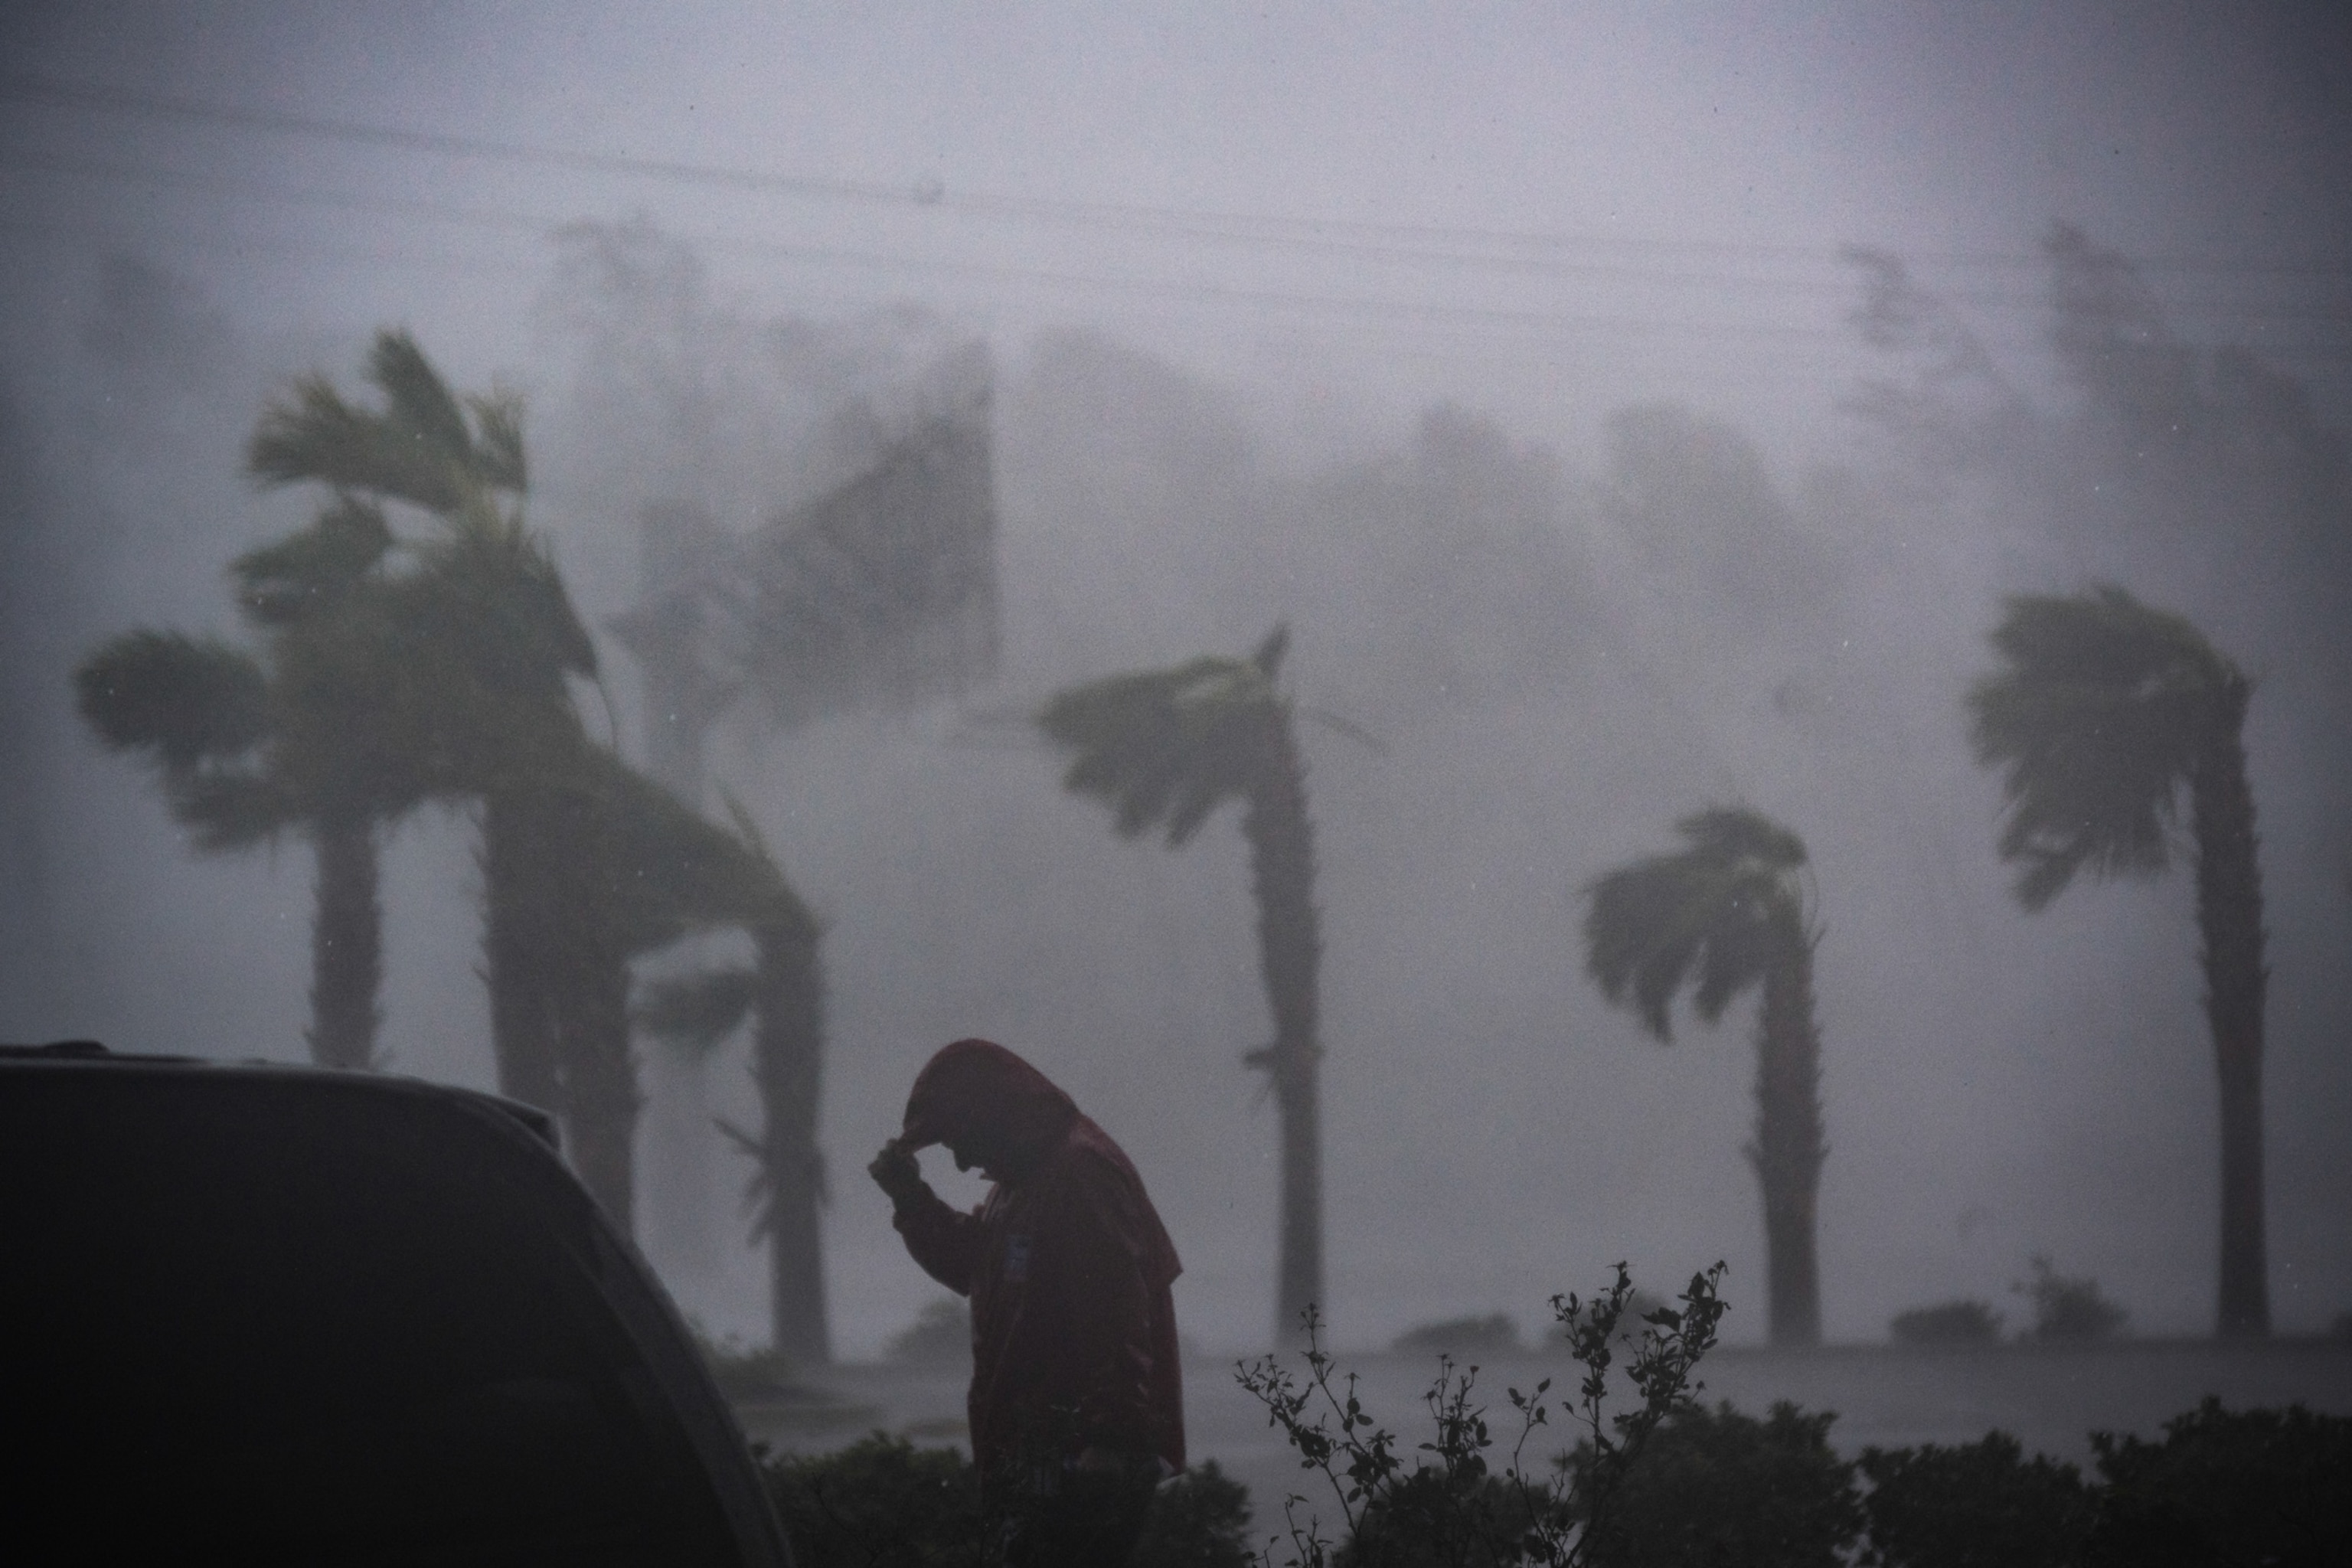
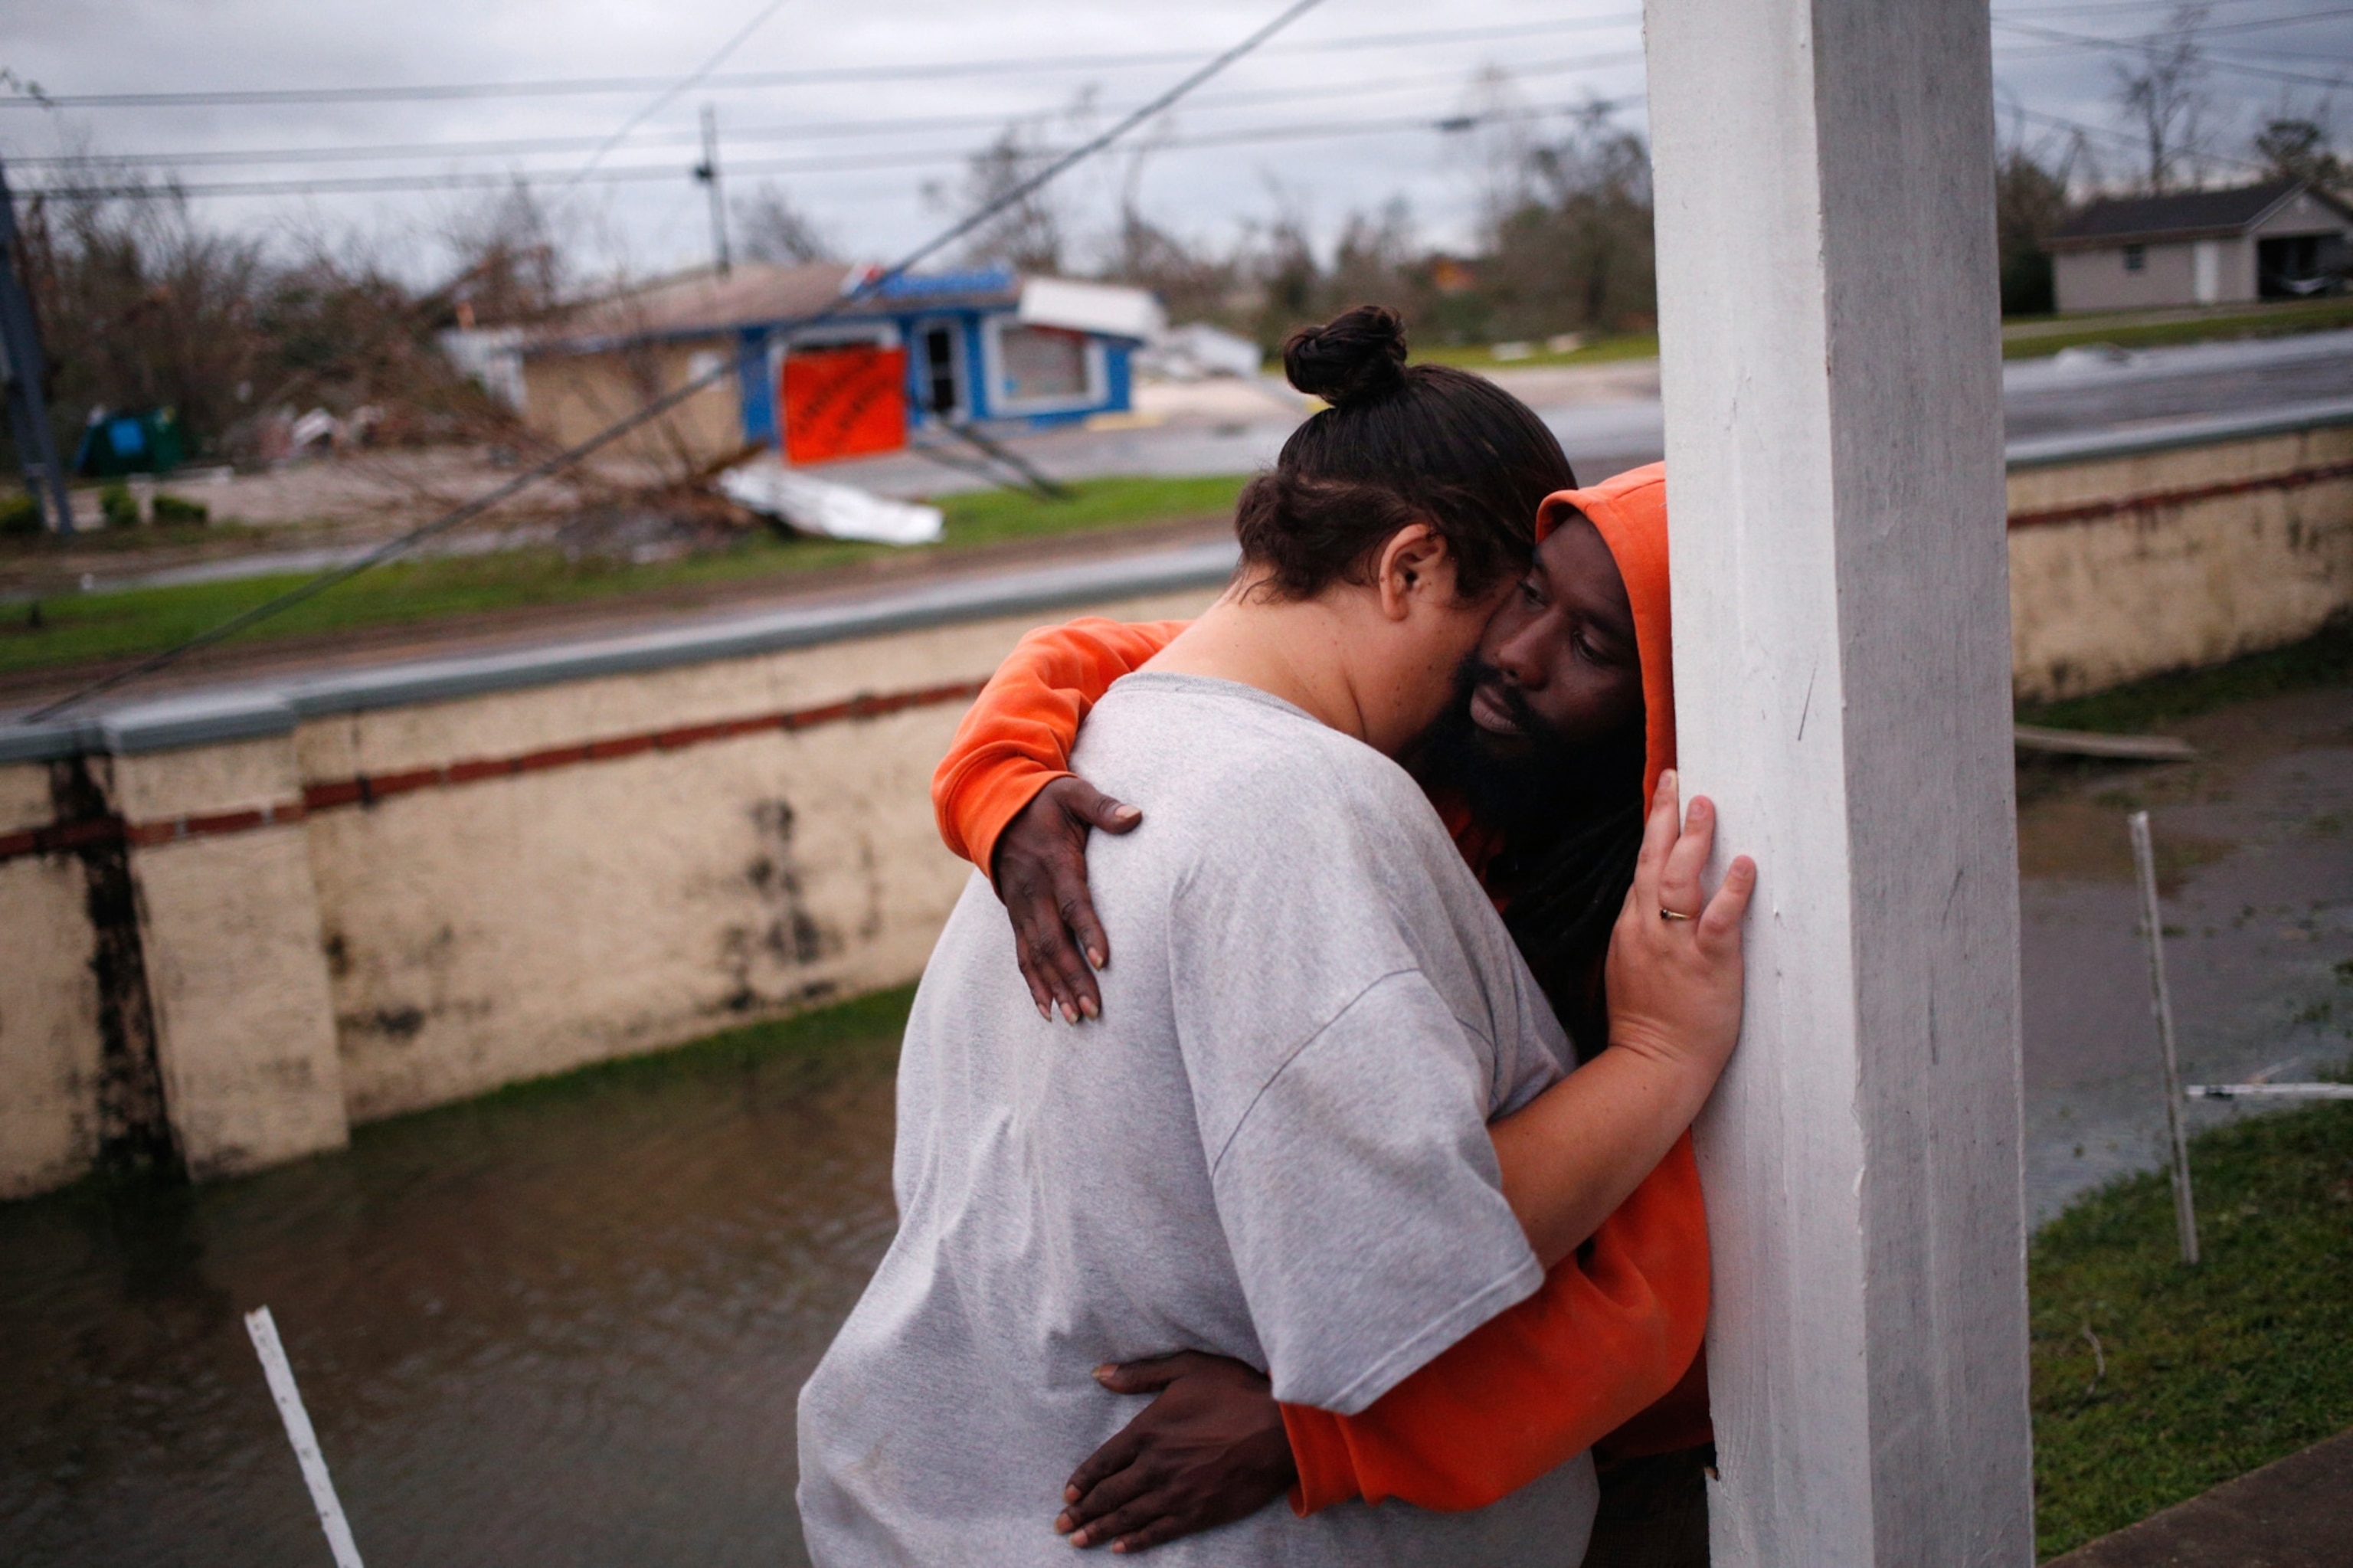
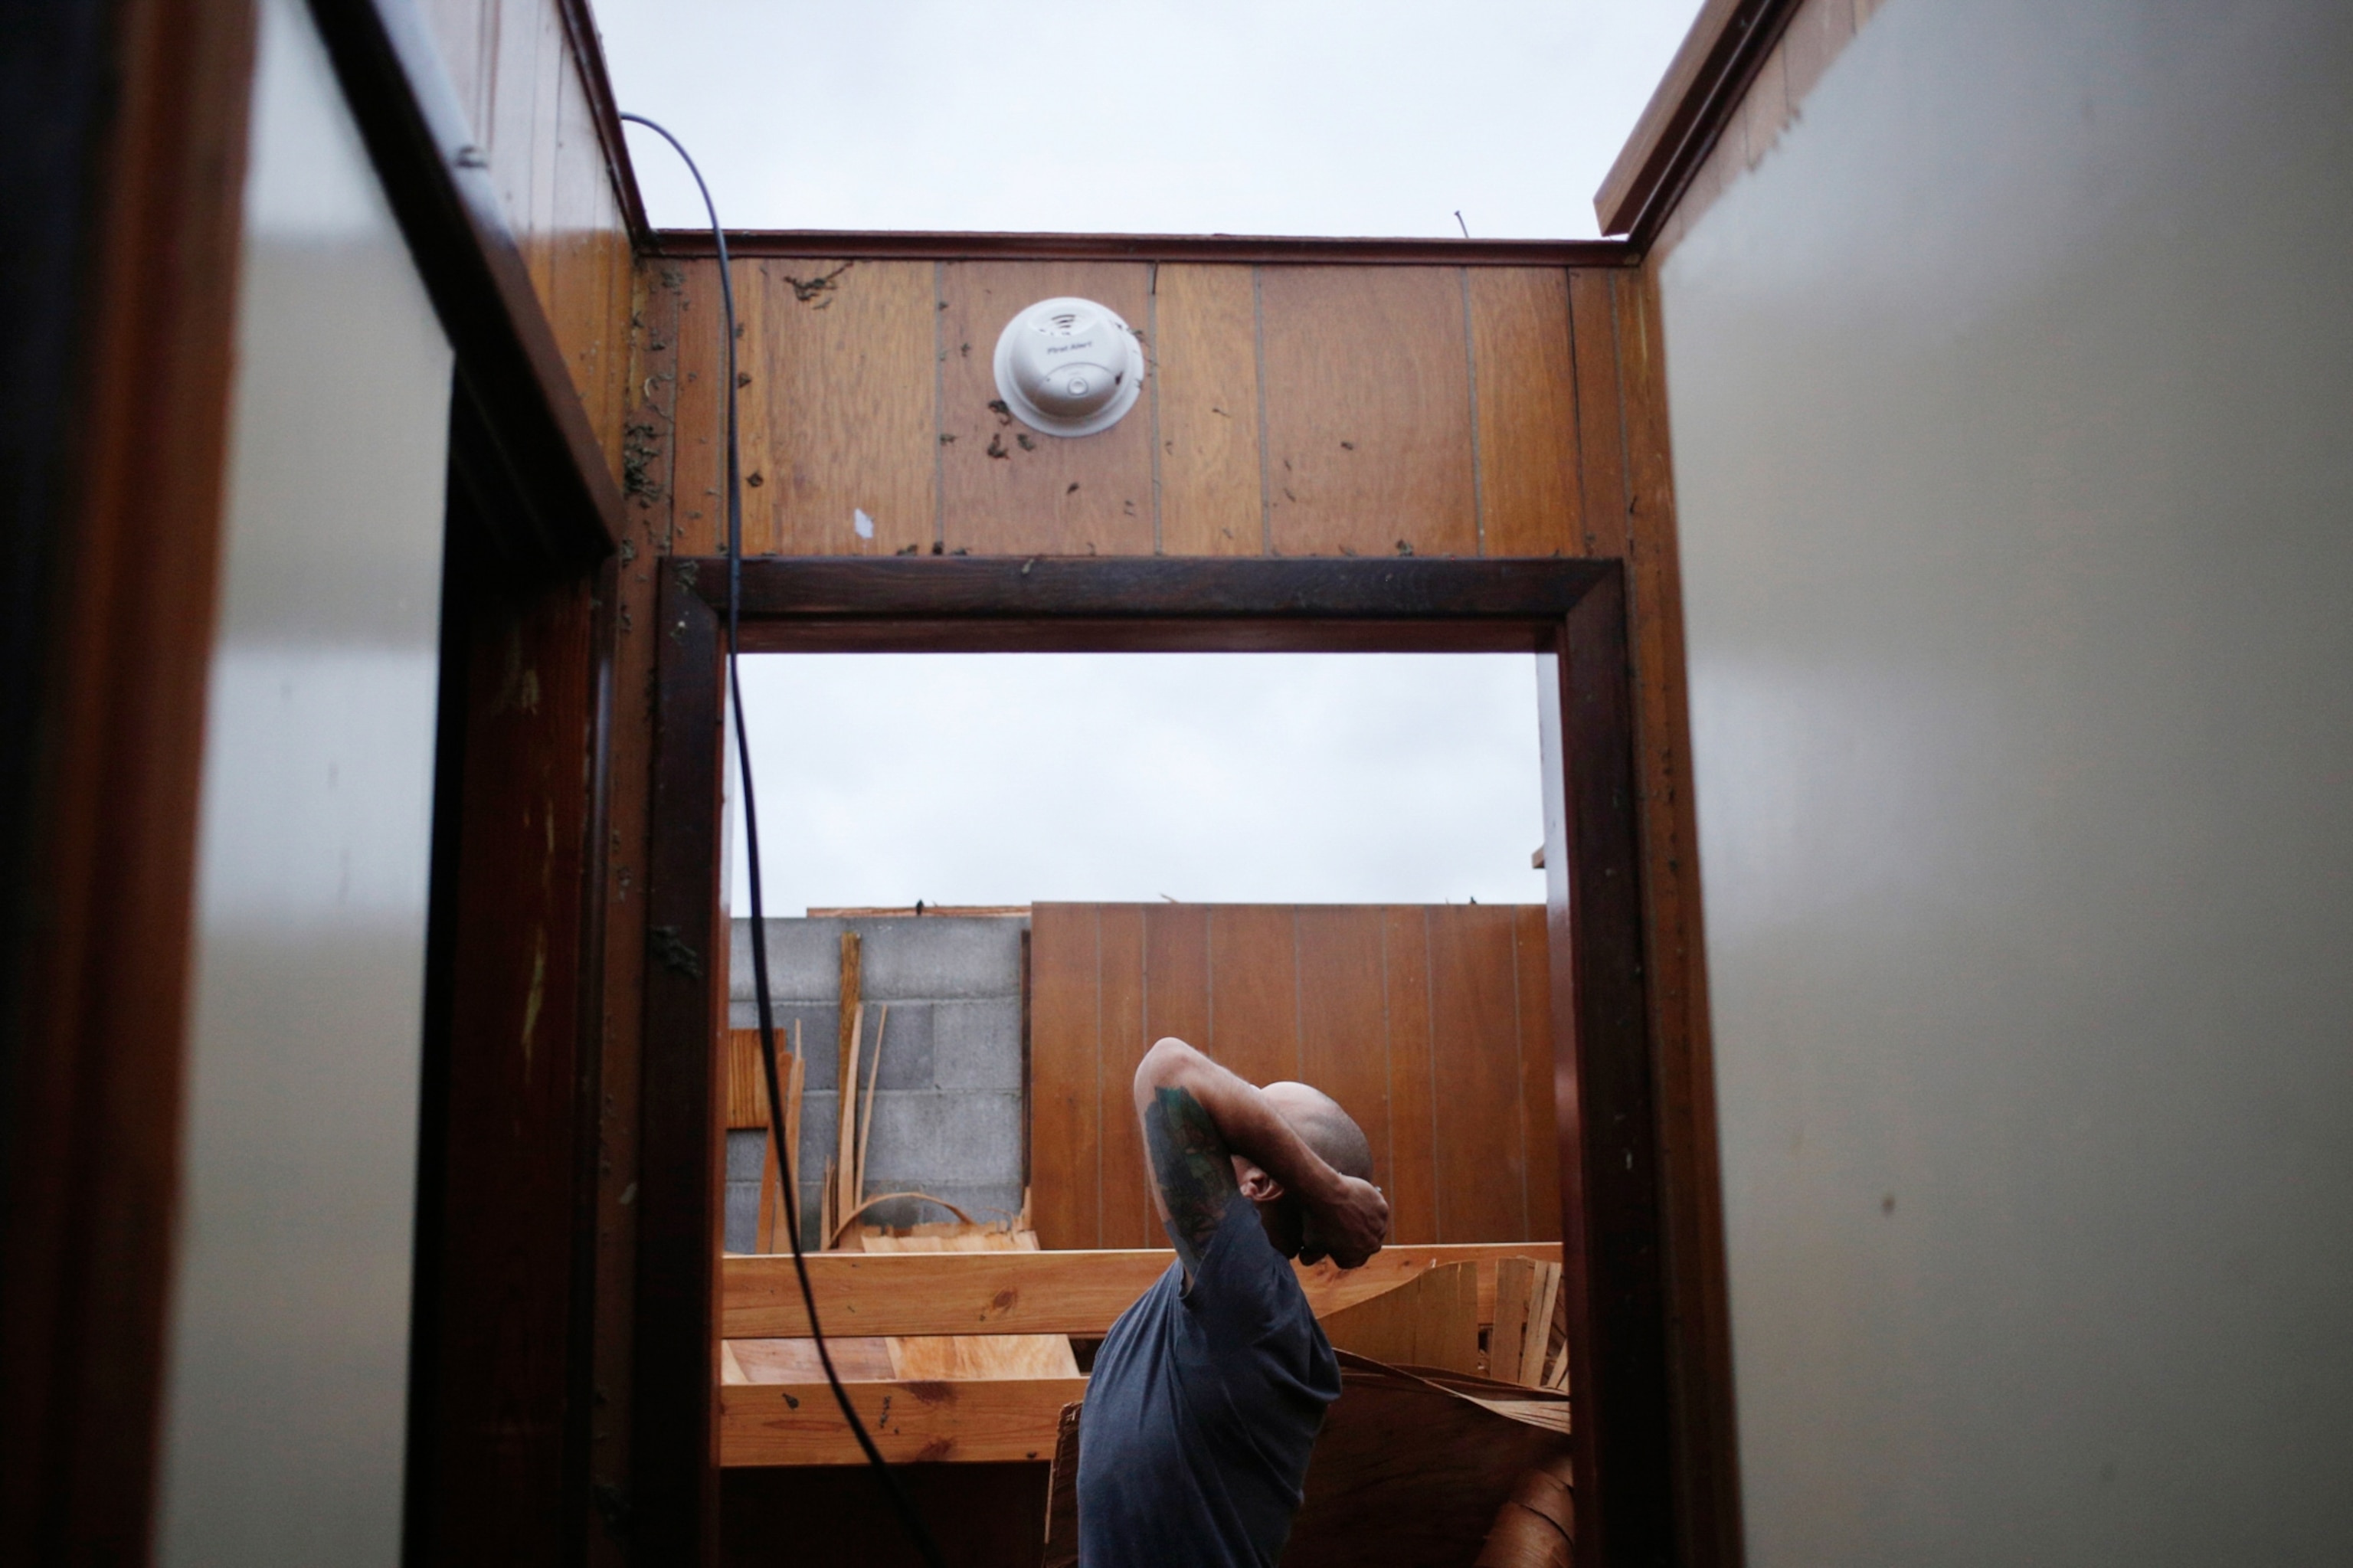
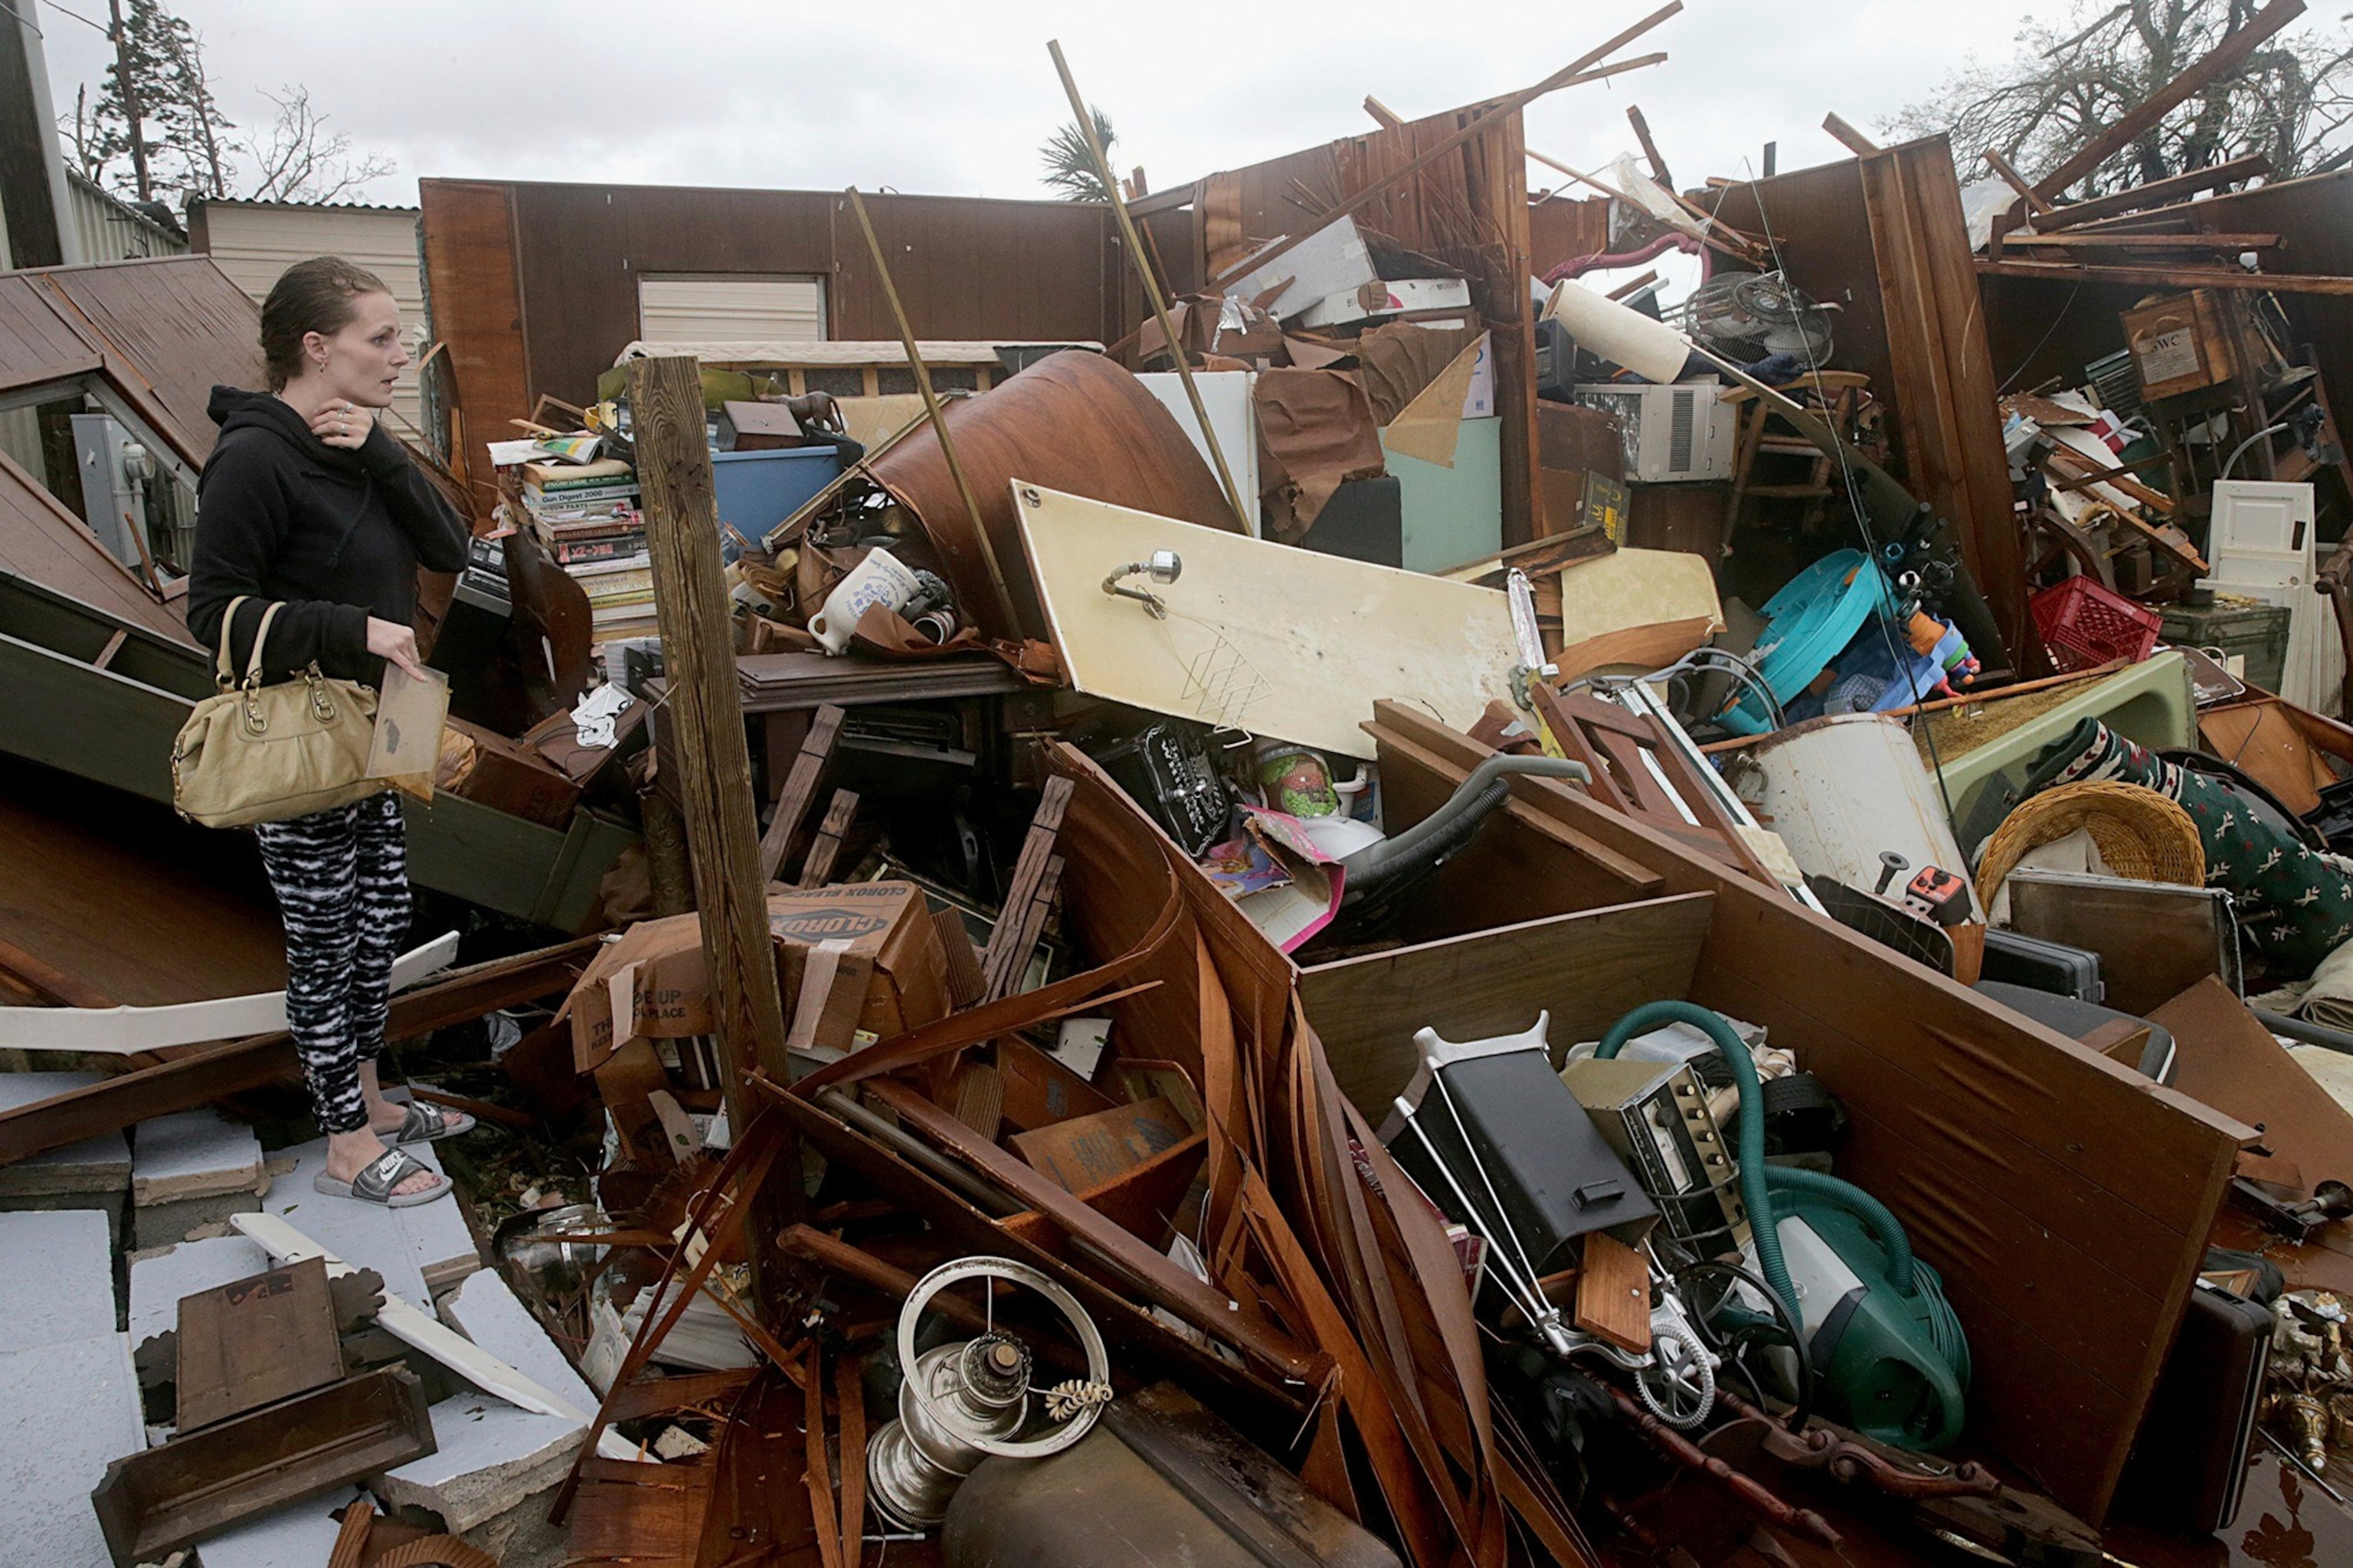
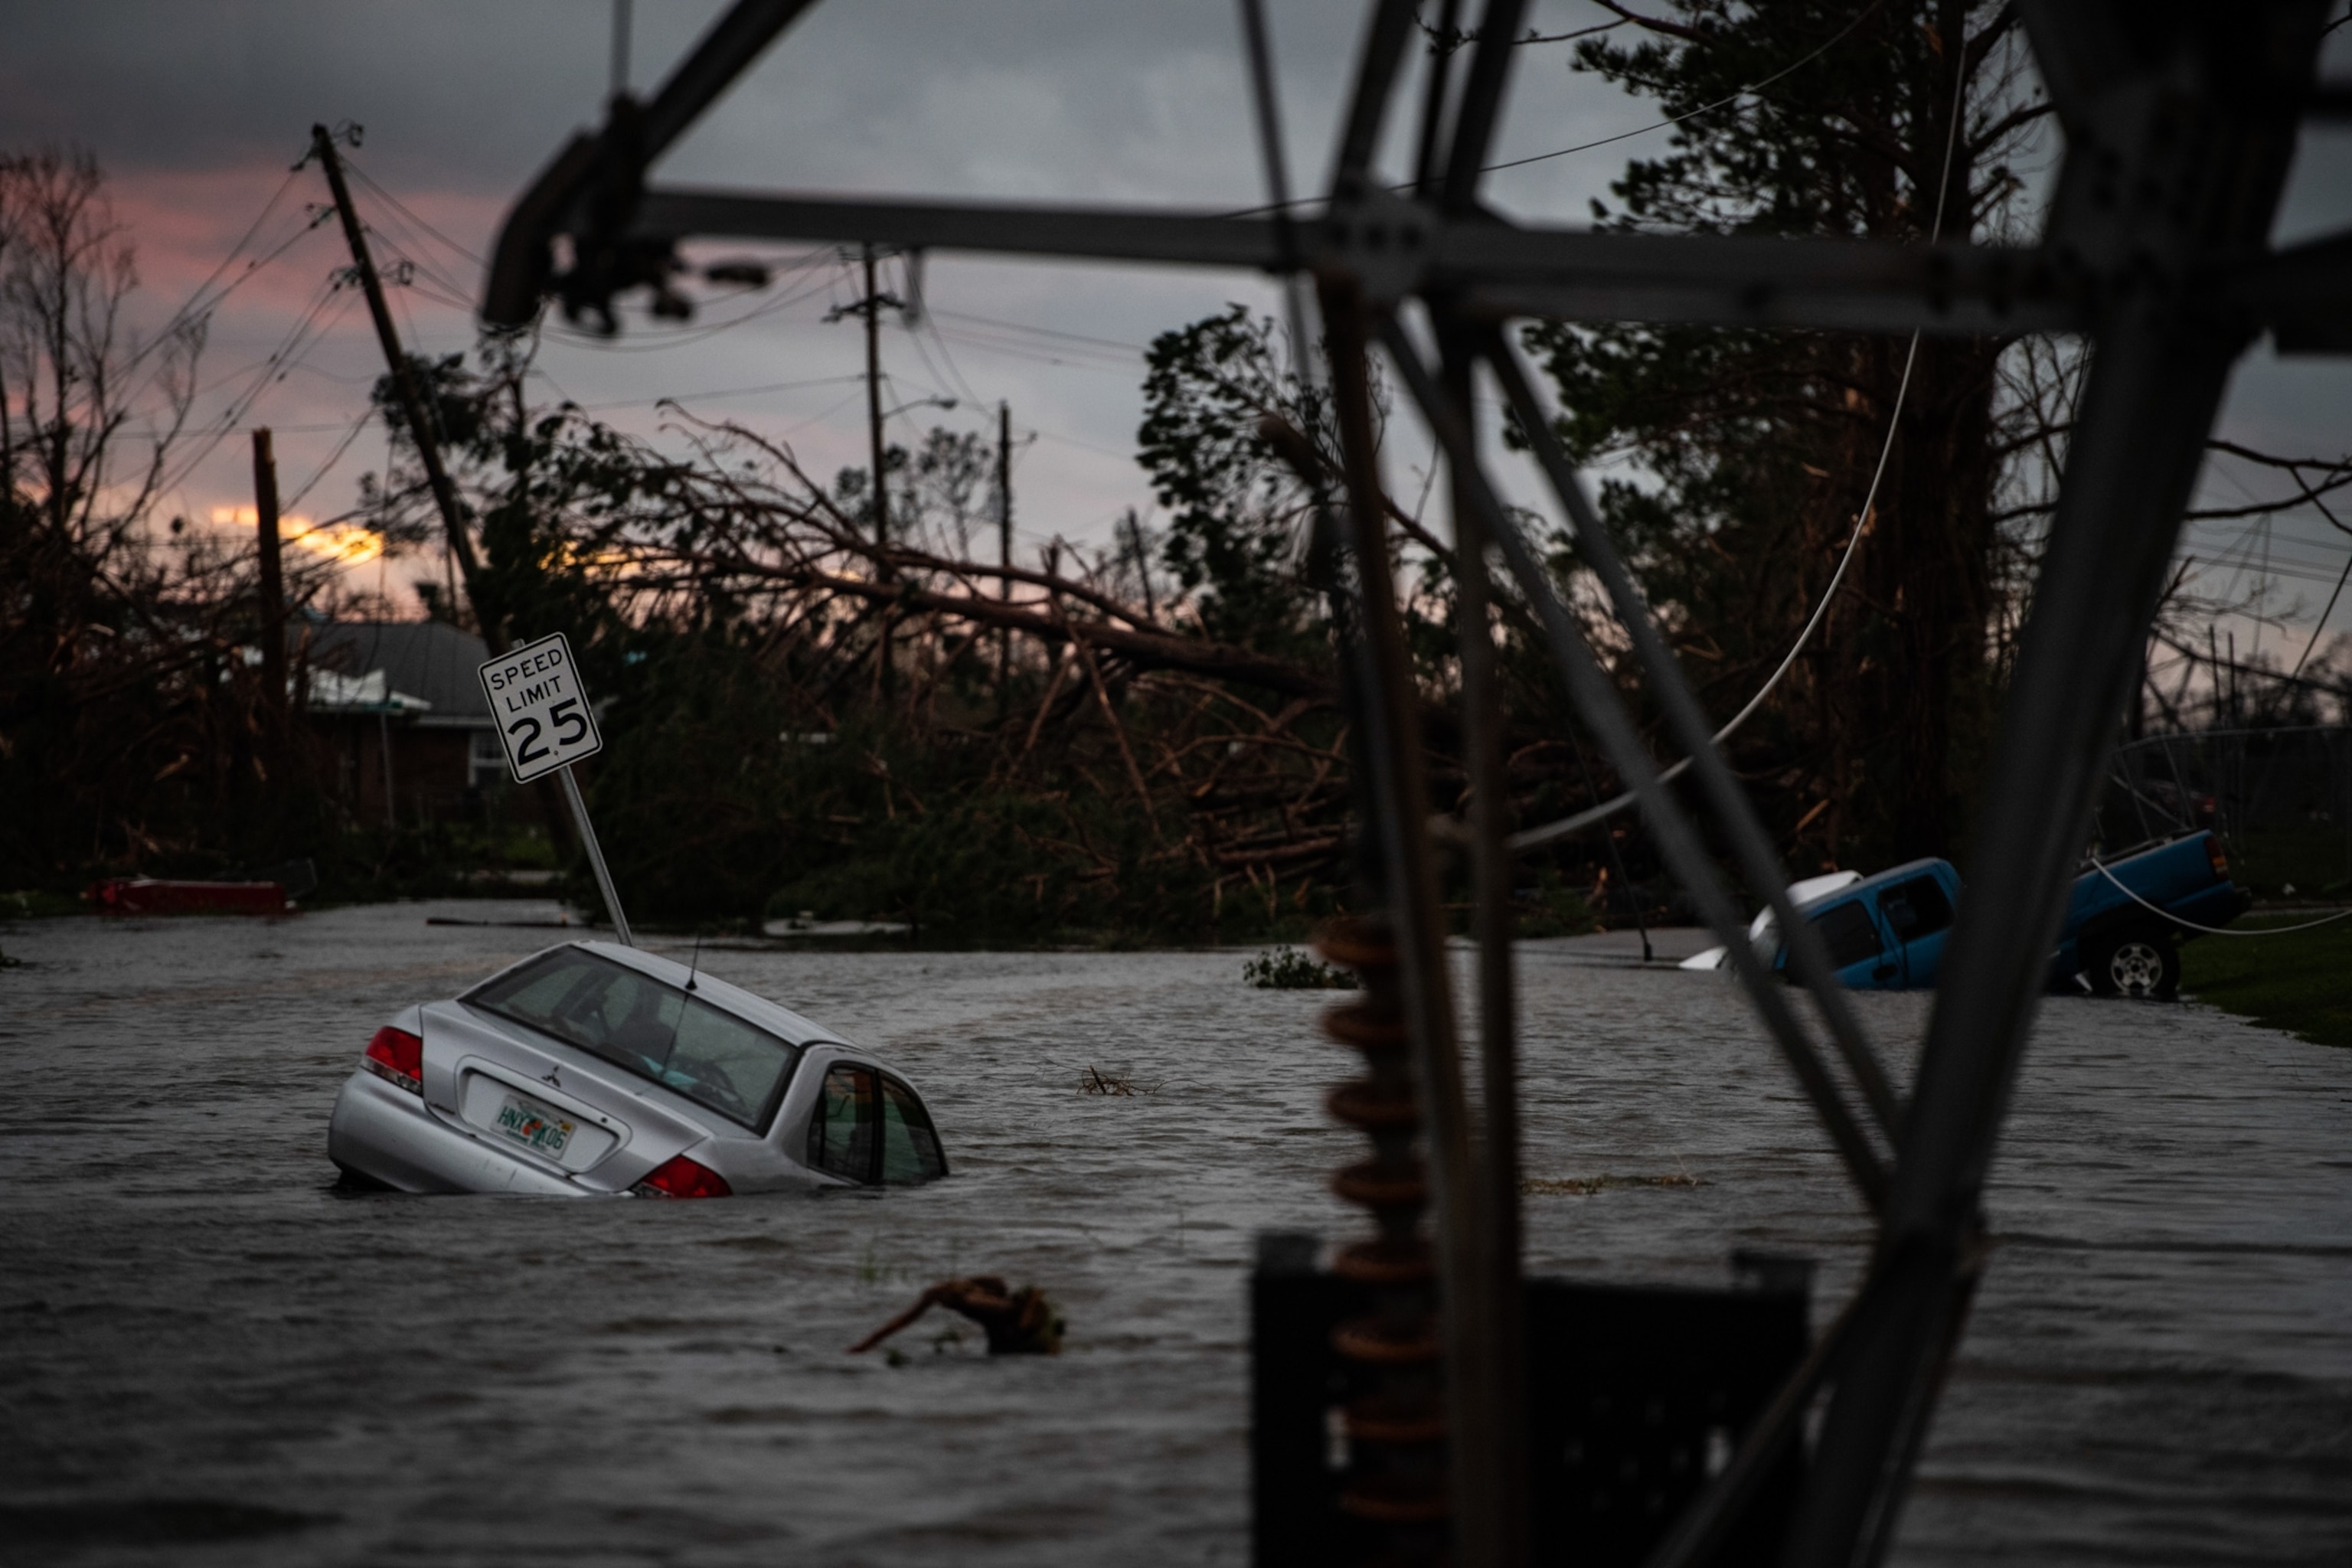
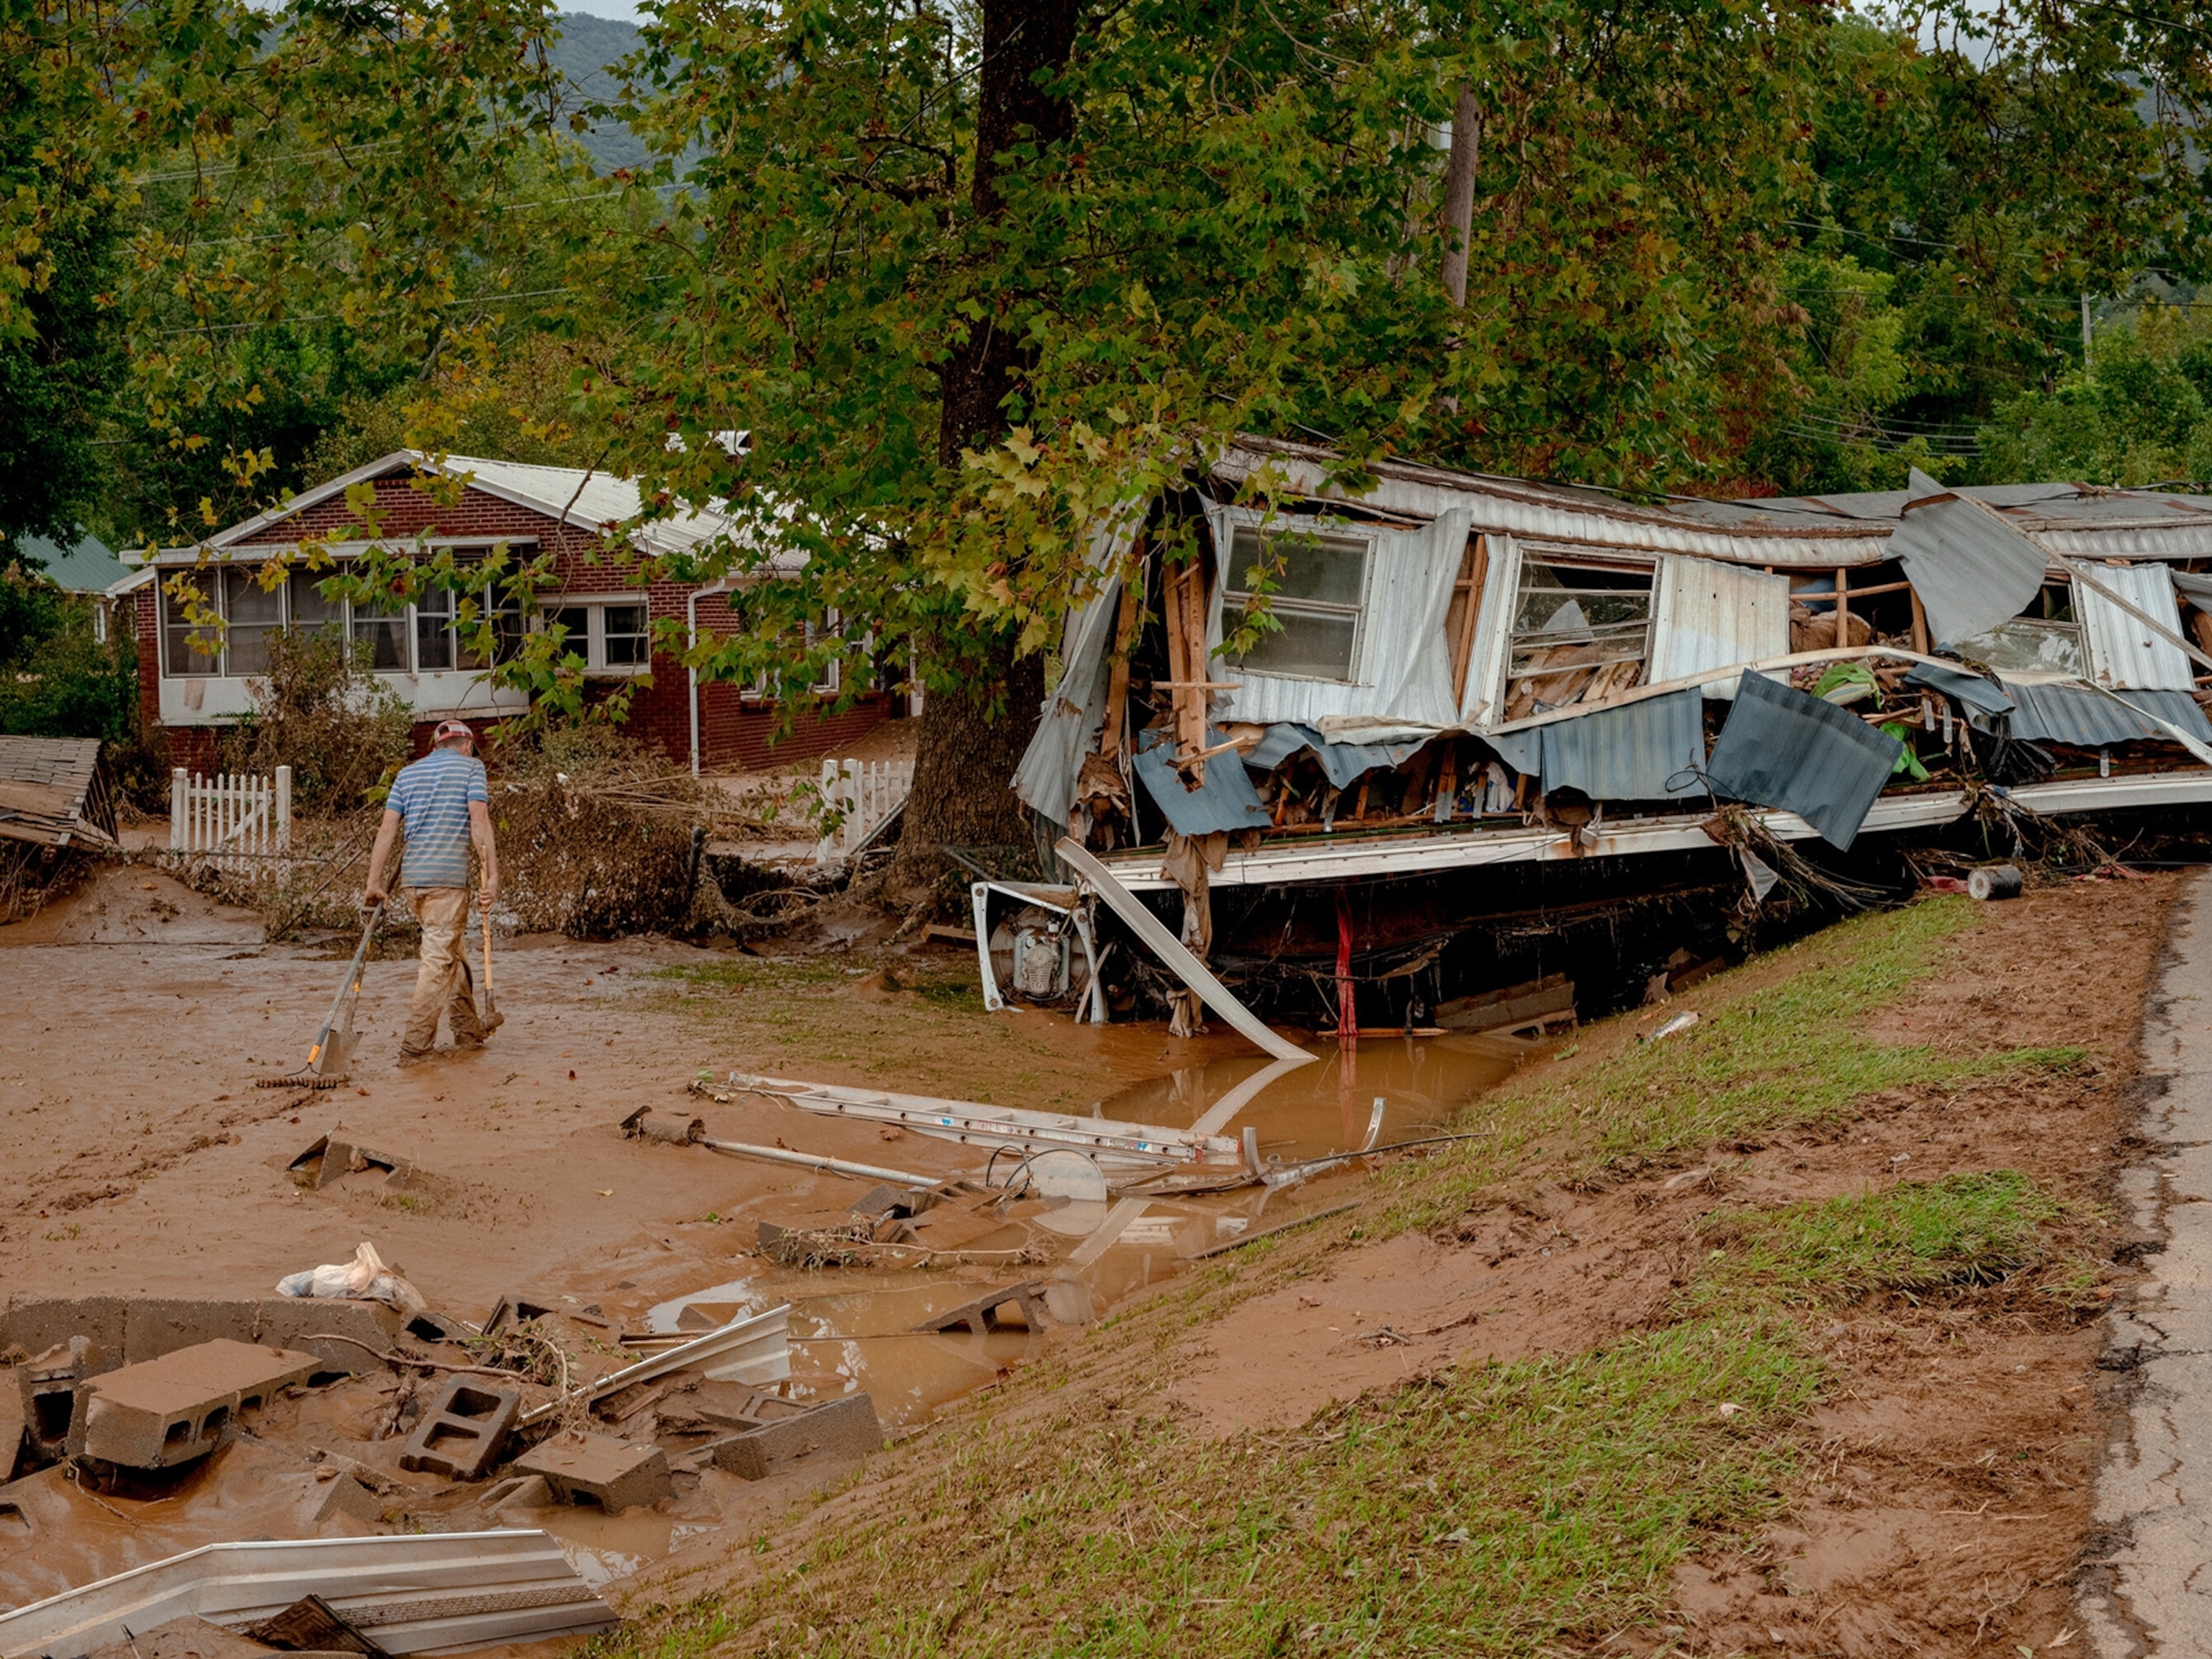
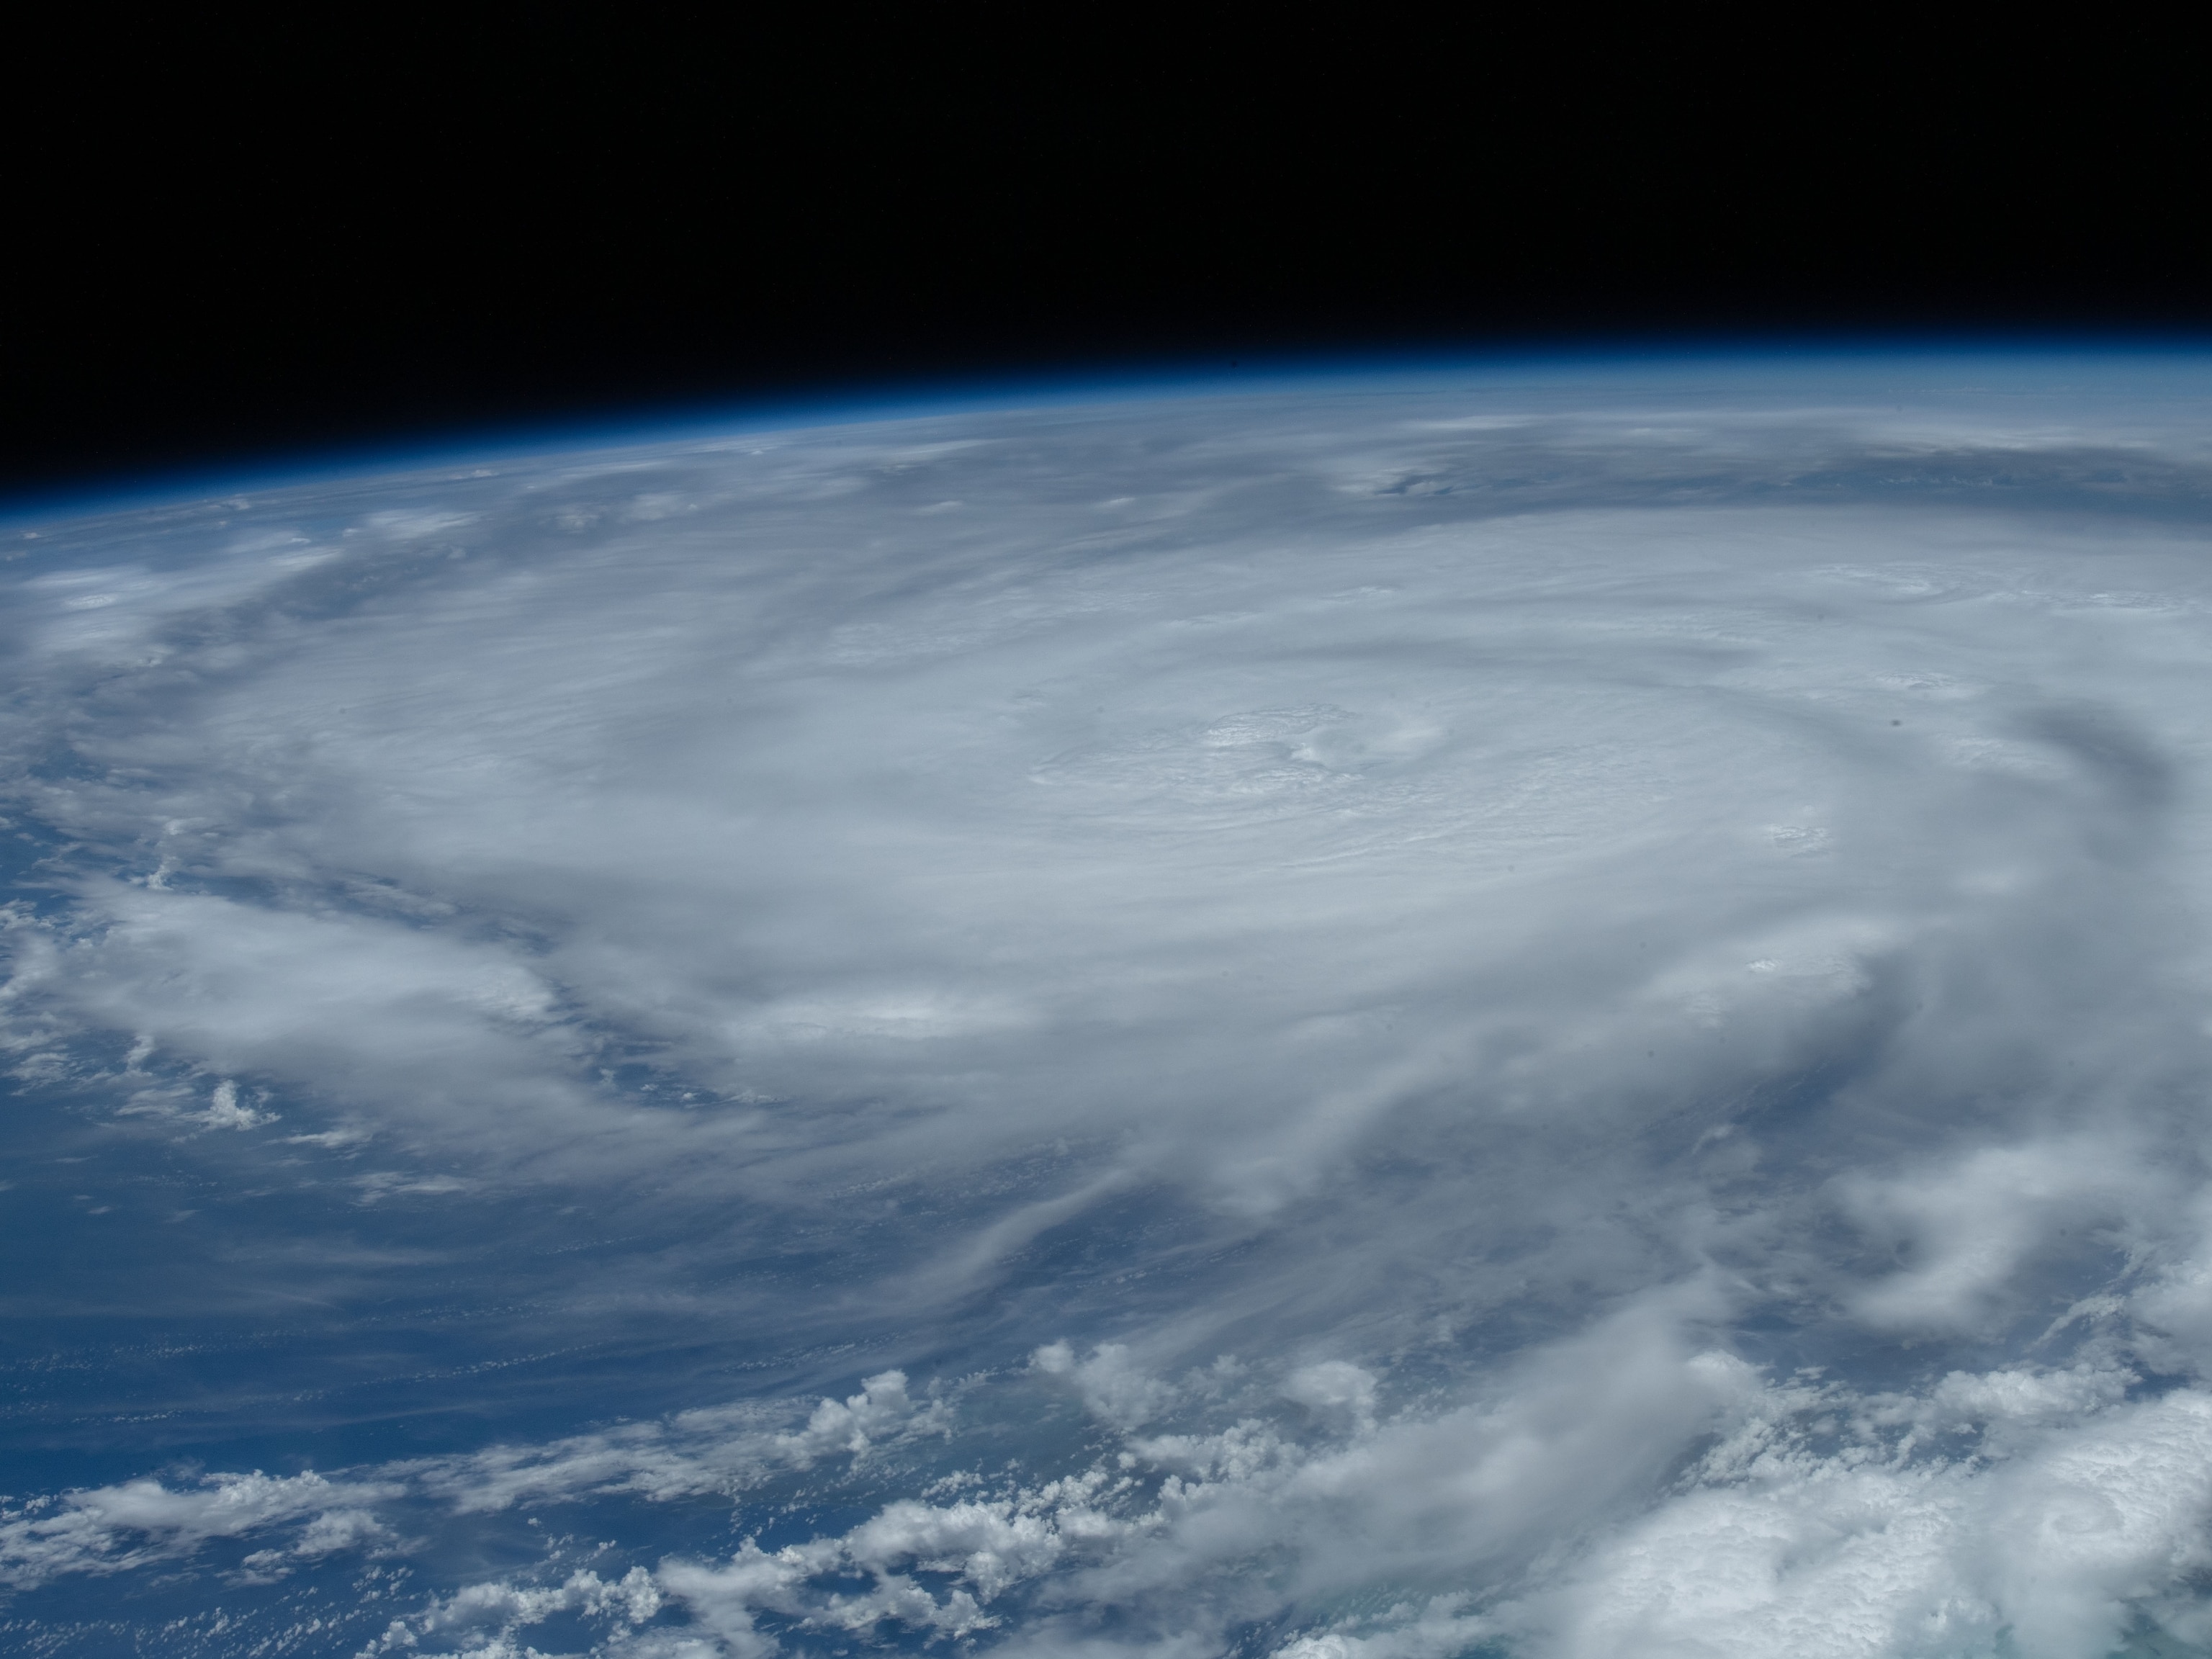
Hurricane Michael was a catastrophically powerful storm that pounced on the Florida Panhandle with vicious 155 mile-per-hour winds and a 14-foot storm surge. It was one of the most powerful landfalling hurricanes on record.
As strong as Michael was, however, there have been many storms more powerful. Some are infamous for the death and destruction they inflicted. Others are all but anonymous because they never made landfall and blew themselves out harmlessly at sea.
And undoubtedly, powerful hurricanes roamed the oceans long before humans were around to witness them.
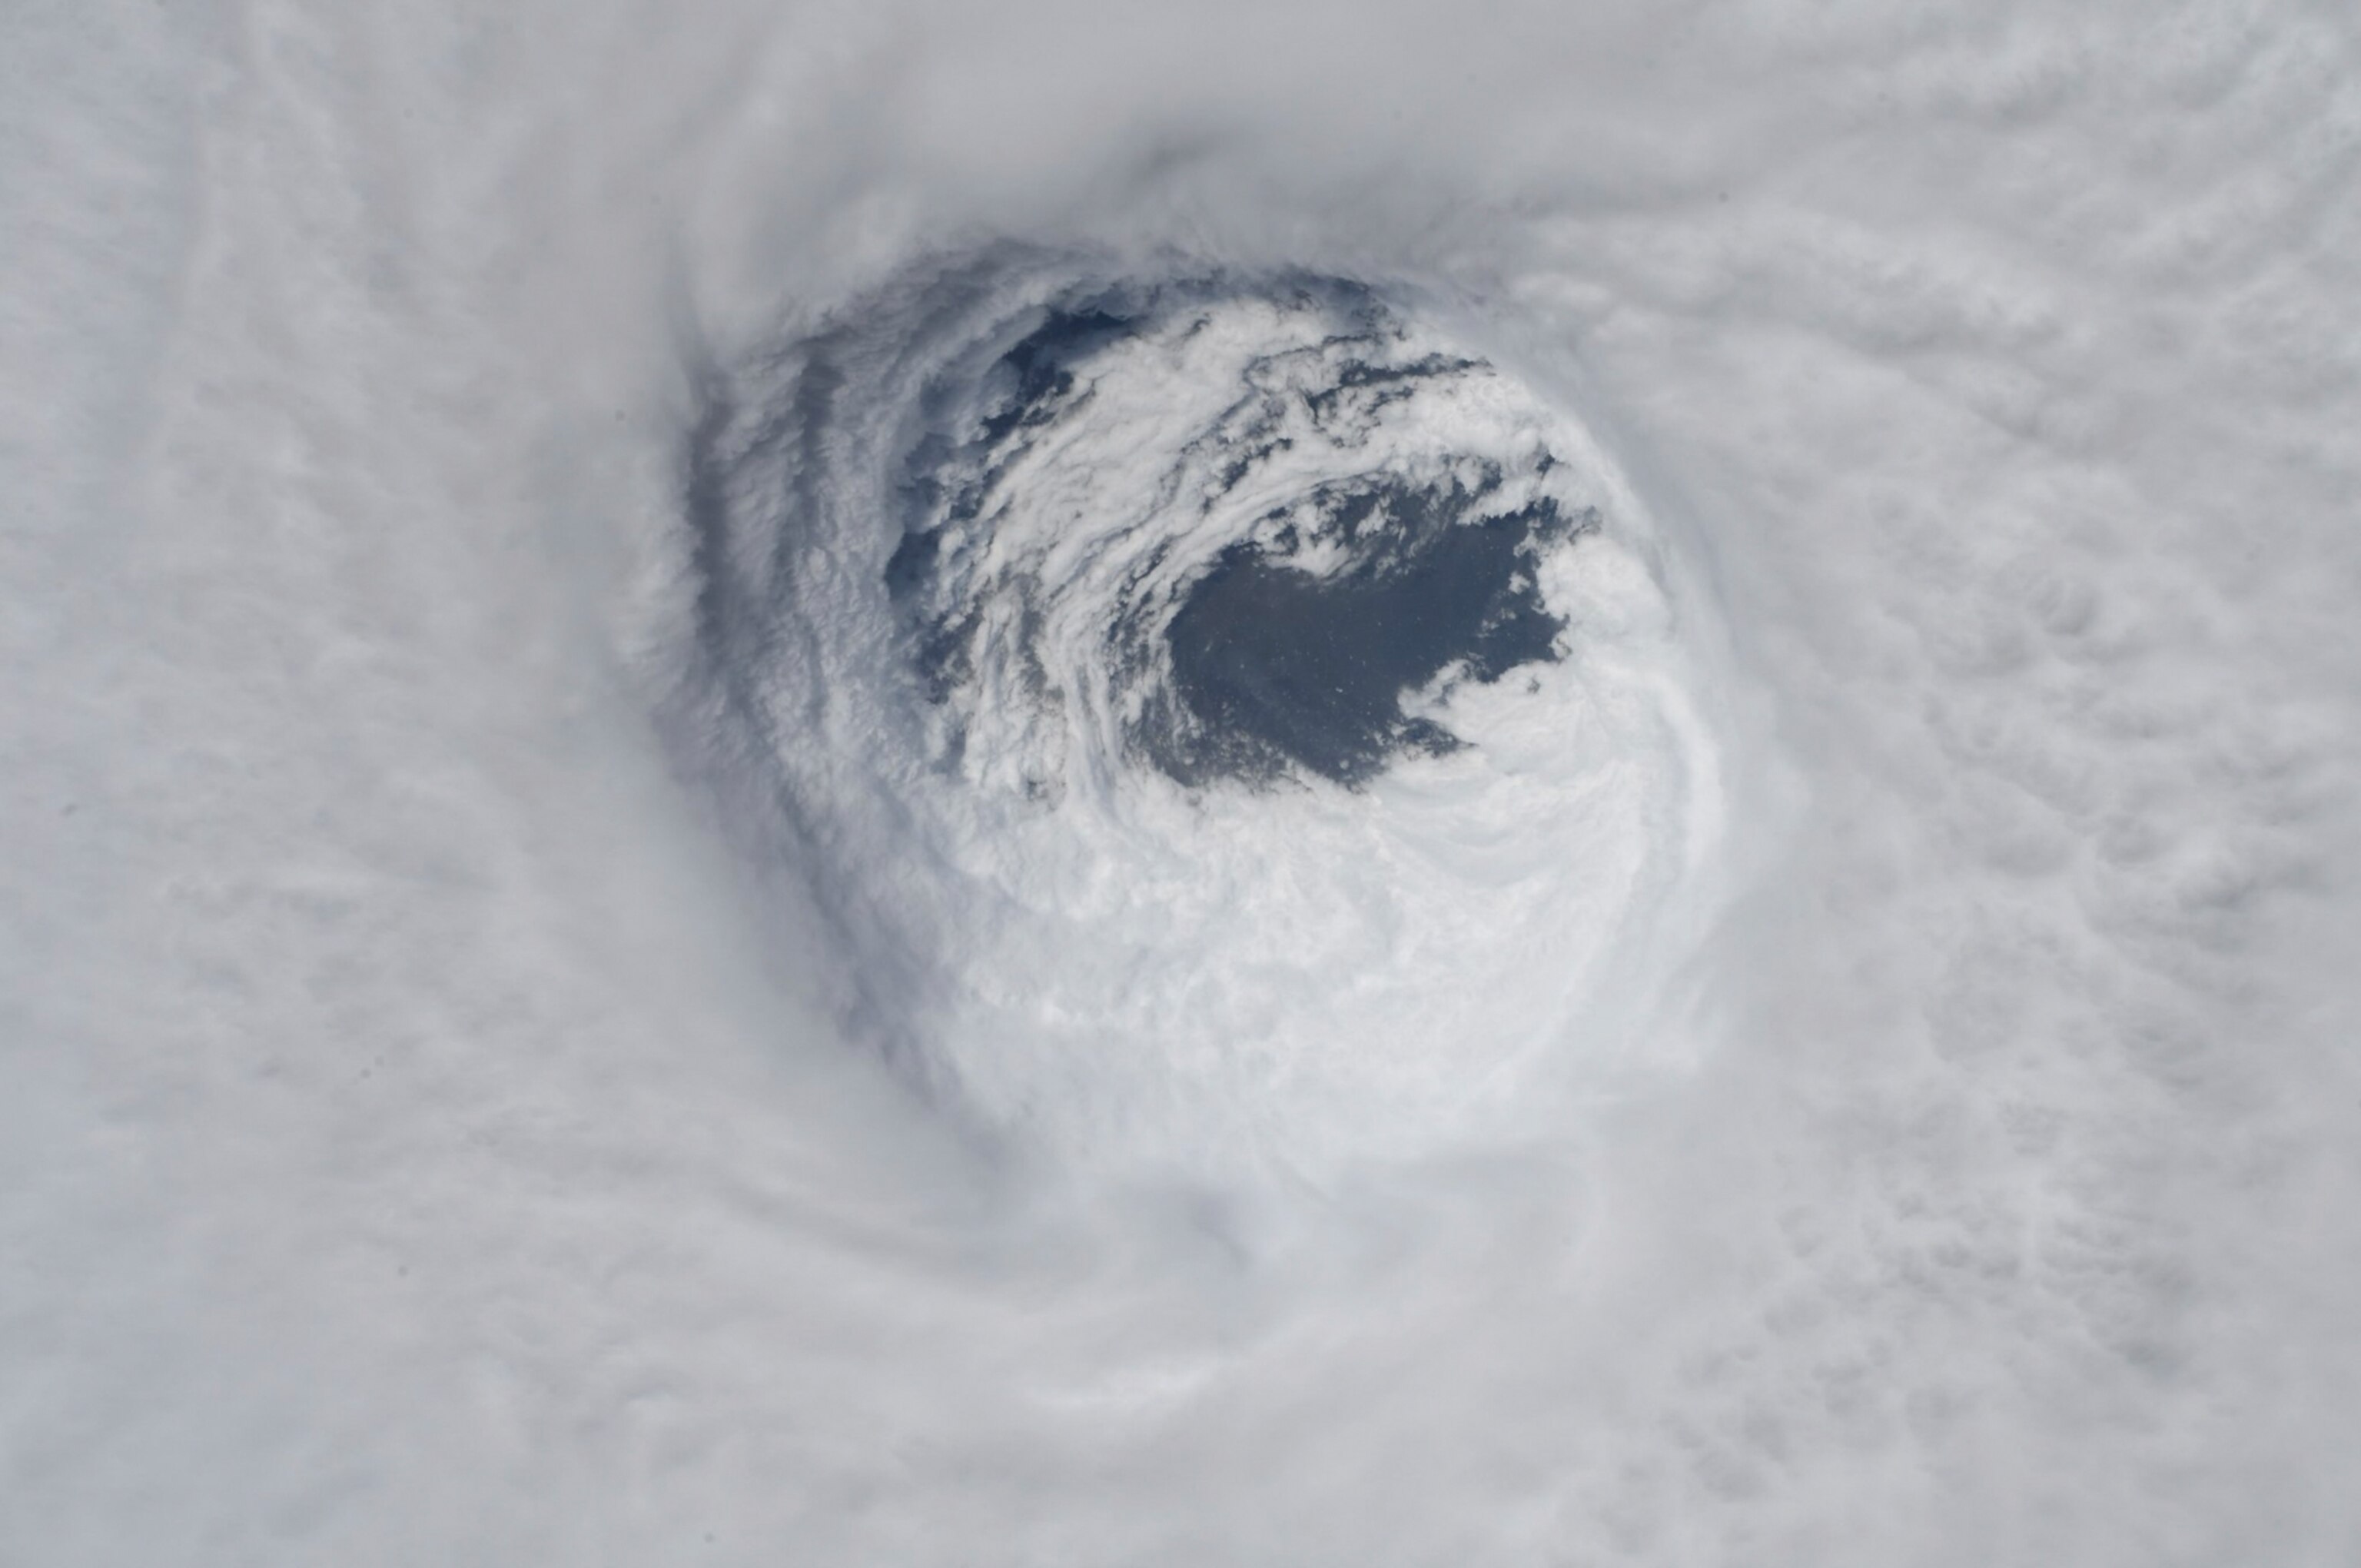
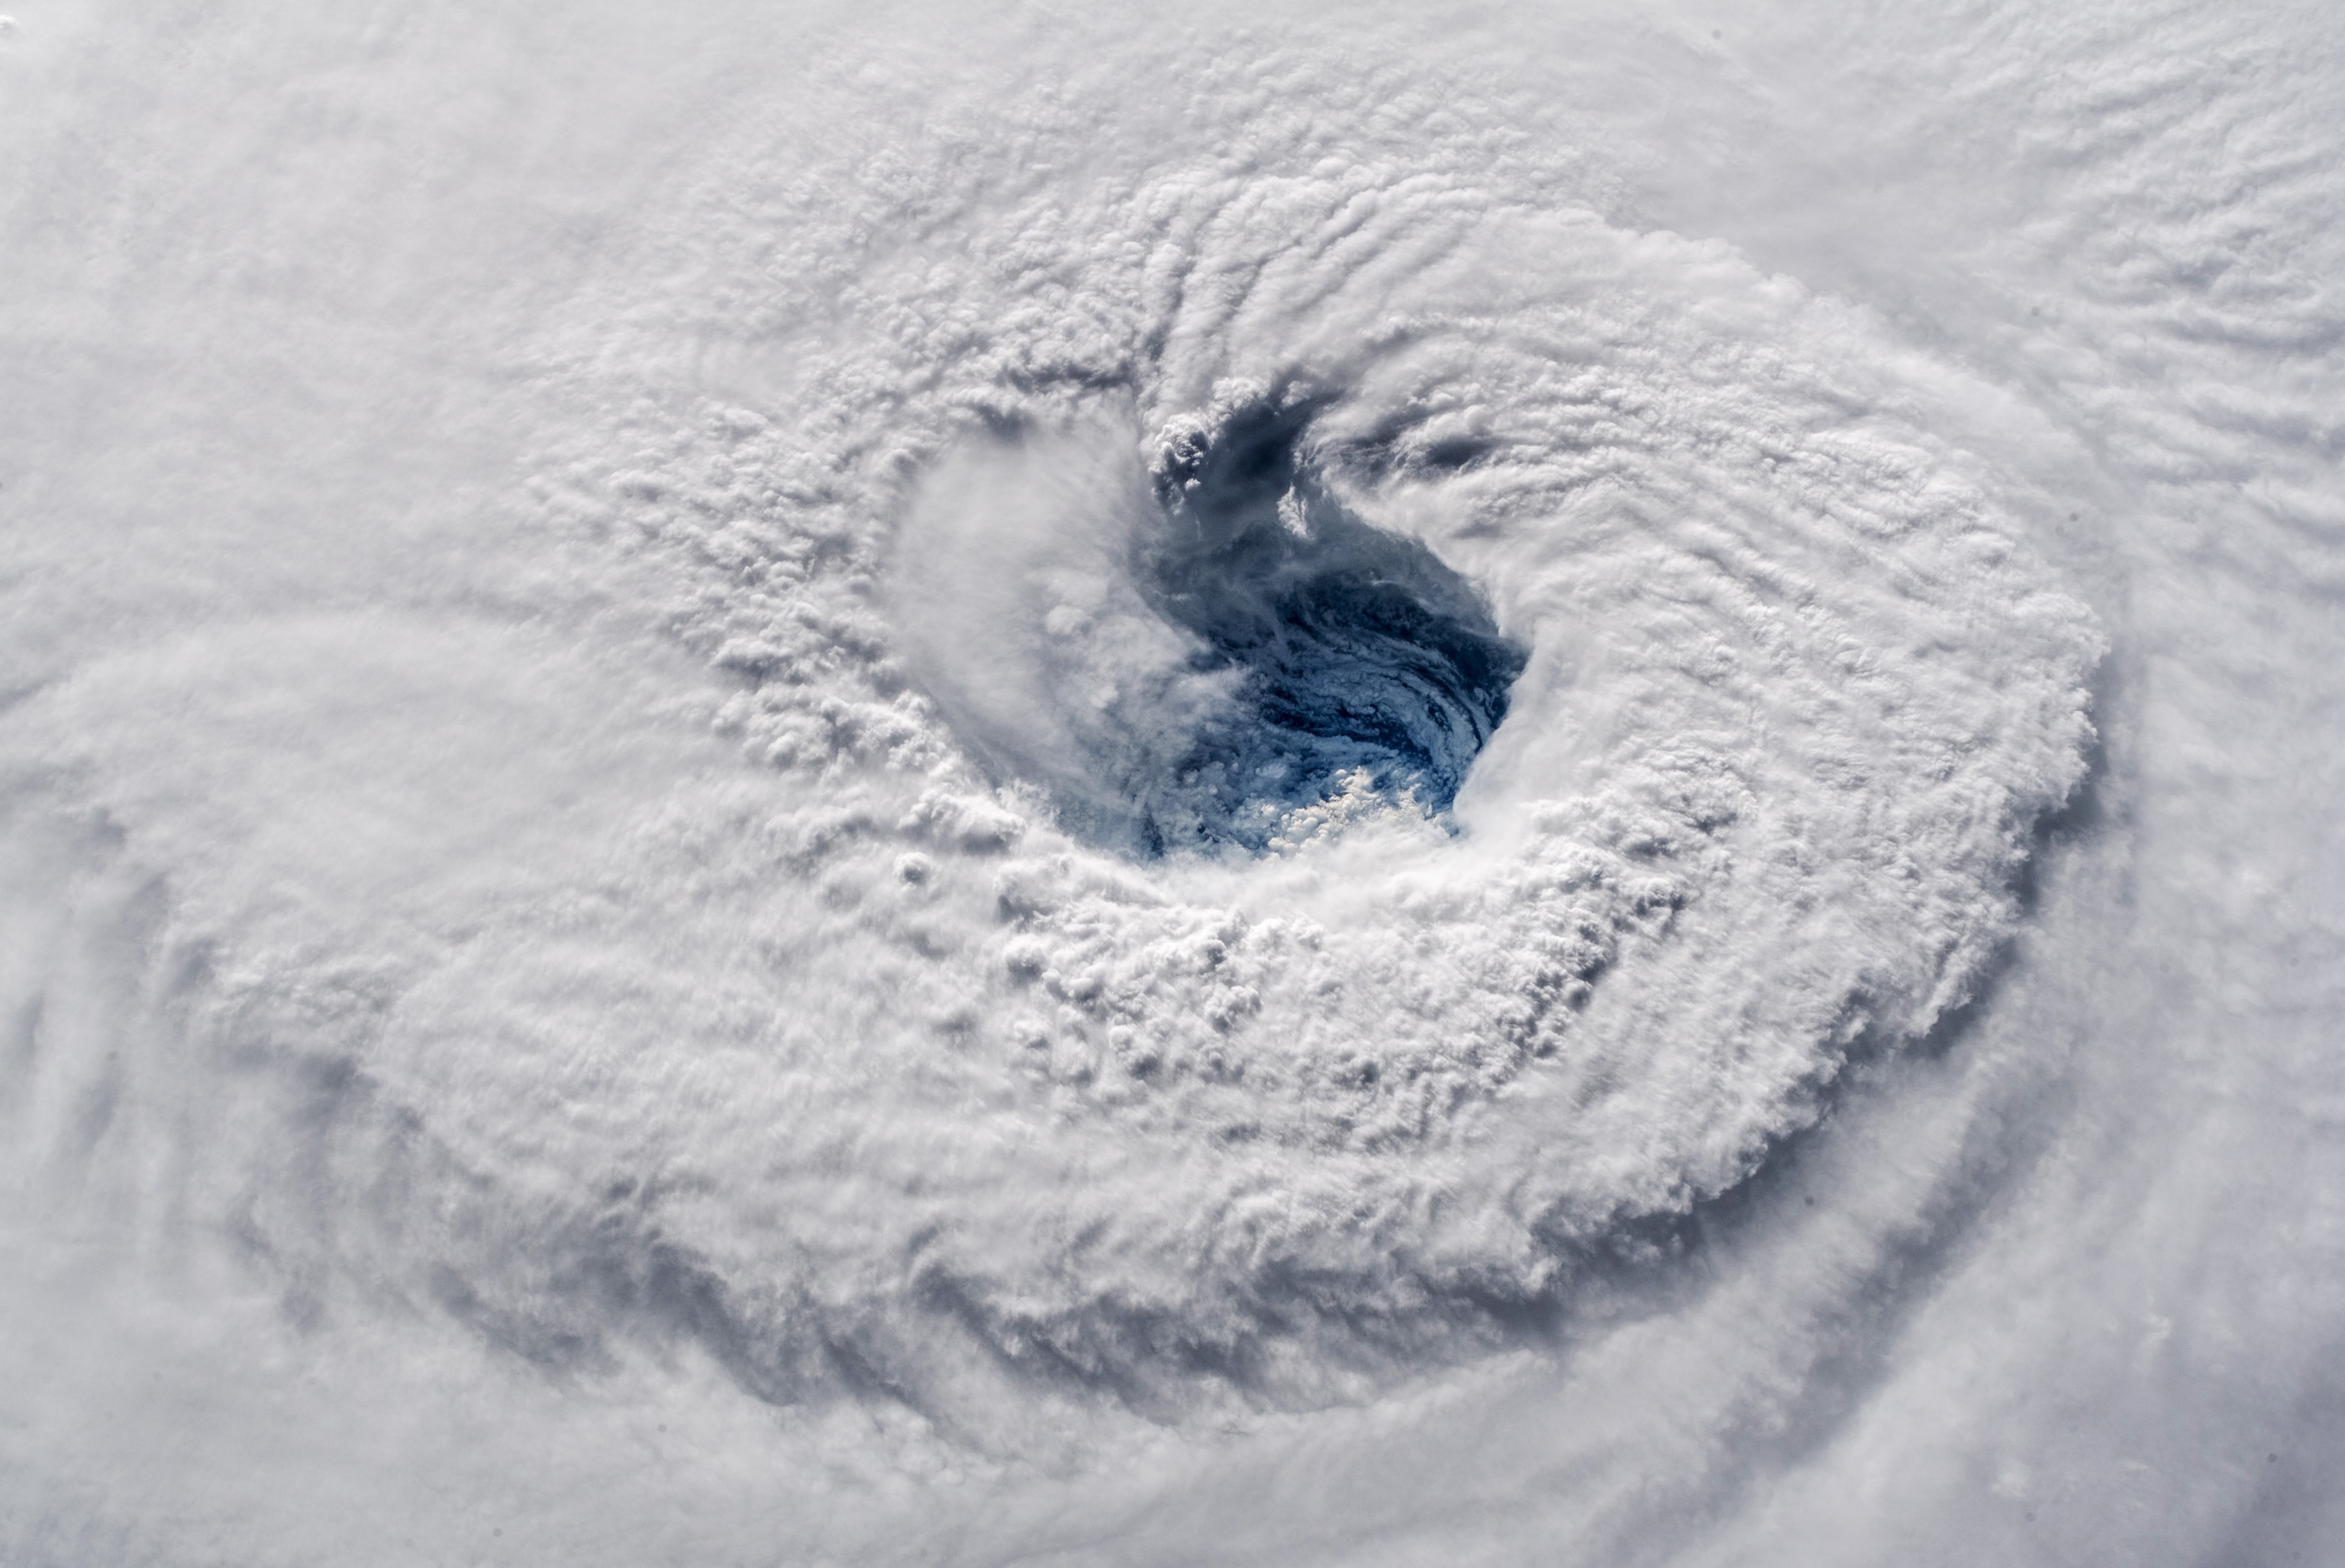
The massive storms are called “hurricanes” in the Atlantic and the eastern Pacific, “typhoons” in the western Pacific, and “cyclones” in the Indian. But they’re all tropical cyclones to scientists.
Although extremely potent storms have formed in the Atlantic Ocean, the most powerful tropical cyclones on record have formed in the Pacific.
“The Pacific, being a much bigger ocean, often gives a hurricane or typhoon more room to roam before it runs into land,” said meteorologist Bryan Norcross, hurricane specialist for WPLG-TV in Miami. “As a result, storms can sometimes grow bigger and stronger.”
Storms in the Indian Ocean are hampered by geography and other weather factors.
“Indian Ocean storms tend to be smaller and weaker, since the ocean basin is not very big,” said Jeff Masters, a meteorologist with the website Weather Underground. “You can't get storms when the ocean temperatures are at their warmest in August and September, due to the interference from the Southwest Monsoon.”
The strength of a tropical cyclone is calculated by two methods—maximum wind speed and barometric pressure readings.
Barometers have been around since the 17th century, but they are still a reliable way to monitor weather conditions. (Hear meteorologist Charlie Neese explain how a barometer works.)
Air has weight, and when the weather is calm and skies are fair, it exerts about 14.7 pounds per square inch on the surface of the Earth. When these conditions exist, a barometer at sea level will show a reading of around 1013 millibars.
Tropical cyclones alter this pressure and reduce the weight of the air. When this happens, a barometric pressure reading decreases. The lower a barometer reading, the more powerful the tropical cyclone. The most powerful tropical cyclone on record as measured by barometric pressure was Typhoon Tip in the western Pacific in 1979. Tip had a pressure of 870 millibars.
The most powerful tropical cyclones also produce the most powerful winds. Typhoon Tip’s peak sustained winds—winds that blew constantly for at least one minute—were 190 miles per hour.
But Tip’s winds are not the strongest on record. That distinction belongs to Hurricane Patricia, which formed in the eastern Pacific off Guatemala in 2015. Patricia’s barometric pressure was 872 millibars, and its peak winds were clocked at 215 miles per hour.
Because Atlantic hurricanes are more likely to strike populated areas, they are monitored more closely than storms in other basins. Hurricane Wilma, which formed off Jamaica in the Caribbean Sea in 2005, had a barometric pressure reading of 882 millibars. Wilma’s peak sustained winds reached 185 miles per hour.
Hurricane Allen had the Atlantic’s most powerful recorded sustained winds. The storm, which formed in 1980, had peak winds of 190 miles per hour and a barometric pressure reading of 899 millibars.
STRONGEST ATLANTIC TROPICAL CYCLONES ON RECORD
Name/Year/Barometric Pressure (mb)/Winds (mph)/Damage (in U.S. 2017 Dollars)
Wilma - 2005 - 882 - 185 - $34.4 billion
Gilbert - 1988 - 888 - 185 - $6.2 billion
Labor Day - 1935 - 892 - 185 - $1.4 billion
Rita - 2005 - 897 - 180 - $23.2 billion
Allen - 1980 - 899 - 190 - $4.7 billion
Camille - 1969 - 900 - 175 - $9.8 billion
Katrina - 2005 - 902 - 175 - $161.6 billion
Mitch - 1998 - 905 - 180 - $9.1 billion
Dean - 2007 - 905 - 175 - $2 billion
Maria - 2017 - 908 - 175 - $91.6 billion
Janet - 1955 - 914 - 175 - $601.8 million
Michael - 2018 - 919 - 155 - To be determined
Andrew - 1992 - 922 - 175 - $49.1 billion
David - 1979 - 924 - 175 - $5.4 billion
Anita - 1977 - 926 - 175 - Unknown
Irma - 2017 - 929 - 180 - $64.7 billion
Felix - 2007 - 929 - 175 - $876 million
Carla - 1961 - 936 - 175 - $2.7 billion
Cuba hurricane - 1932 - 964* - 175 - Unknown
(*) The barometric pressure of the Cuba hurricane of 1932 was measured at landfall and not while the storm was at sea. The storm’s lowest barometric pressure reading undoubtedly was lower than 964 millibars.
STRONGEST PACIFIC TROPICAL CYCLONES ON RECORD*
Name/Year/Barometric Pressure (mb)/Winds (mph)/Damage (in U.S. 2017 Dollars)
Tip - 1979 - 870 - 190 - Unavailable
Patricia - 2015 - 872 - 215 - $260 million
Forrest - 1983 - 876 - 175 - Unknown
Ida - 1958 - 877 - 200 - $436.7 million
Nora - 1973 - 877 - 185 - At least $11.4 million
Rita - 1978 - 878 - 175 - $387 million
Kit - 1966 - 880 - 195 - No landfall
Vanessa - 1984 - 880 - 195 - No landfall
Irma - 1971 - 884 - 180 - No landfall
Joan - 1959 - 885 - 195 - Unknown
Nina - 1953 - 885 - 185 - Unknown
Megi - 2010 - 885 - 185 - $821 million
Meranti - 2016 - 890 - 195 - $4.9 billion
Haiyan - 2013 - 895 - 195 - $15.2 billion
Vera - 1959 - 895 - 190 - $2.2 billion
Linda - 1997 - 902 - 183 - $4.9 million
Sarah - 1959 - 905 - 190 - $842.3 million
Charlotte - 1959 - 905 - 165 - Unknown
Rick - 2009 - 906 - 180 - $17.2 million
Dinah - 1959 - 915 - 175 - Unknown
Kenna - 2002 - 913 - 165 - $142 million
Ava - 1973 - 915 - 160 - No landfall
Ioke - 2006 - 915 - 160 - $110.1 million
Marie - 2014 - 918 - 160 - $21.3 million
Odile - 2014 - 918 - 140 - $1.3 billion
Guillermo - 1997 - 919 - 160 - No landfall
Gilma - 1994 - 920 - 160 - No landfall
Walaka - 2018 - 920 - 160 - No landfall
*The U.S. military discontinued research flights into Pacific tropical cyclones in 1987. Japan sometimes sends research aircraft into storms at sea, but meteorologists usually estimate the intensity of Pacific tropical cyclones by analyzing satellite images. The image analysis is not considered as accurate as data obtained from a research aircraft flying into the storm.
