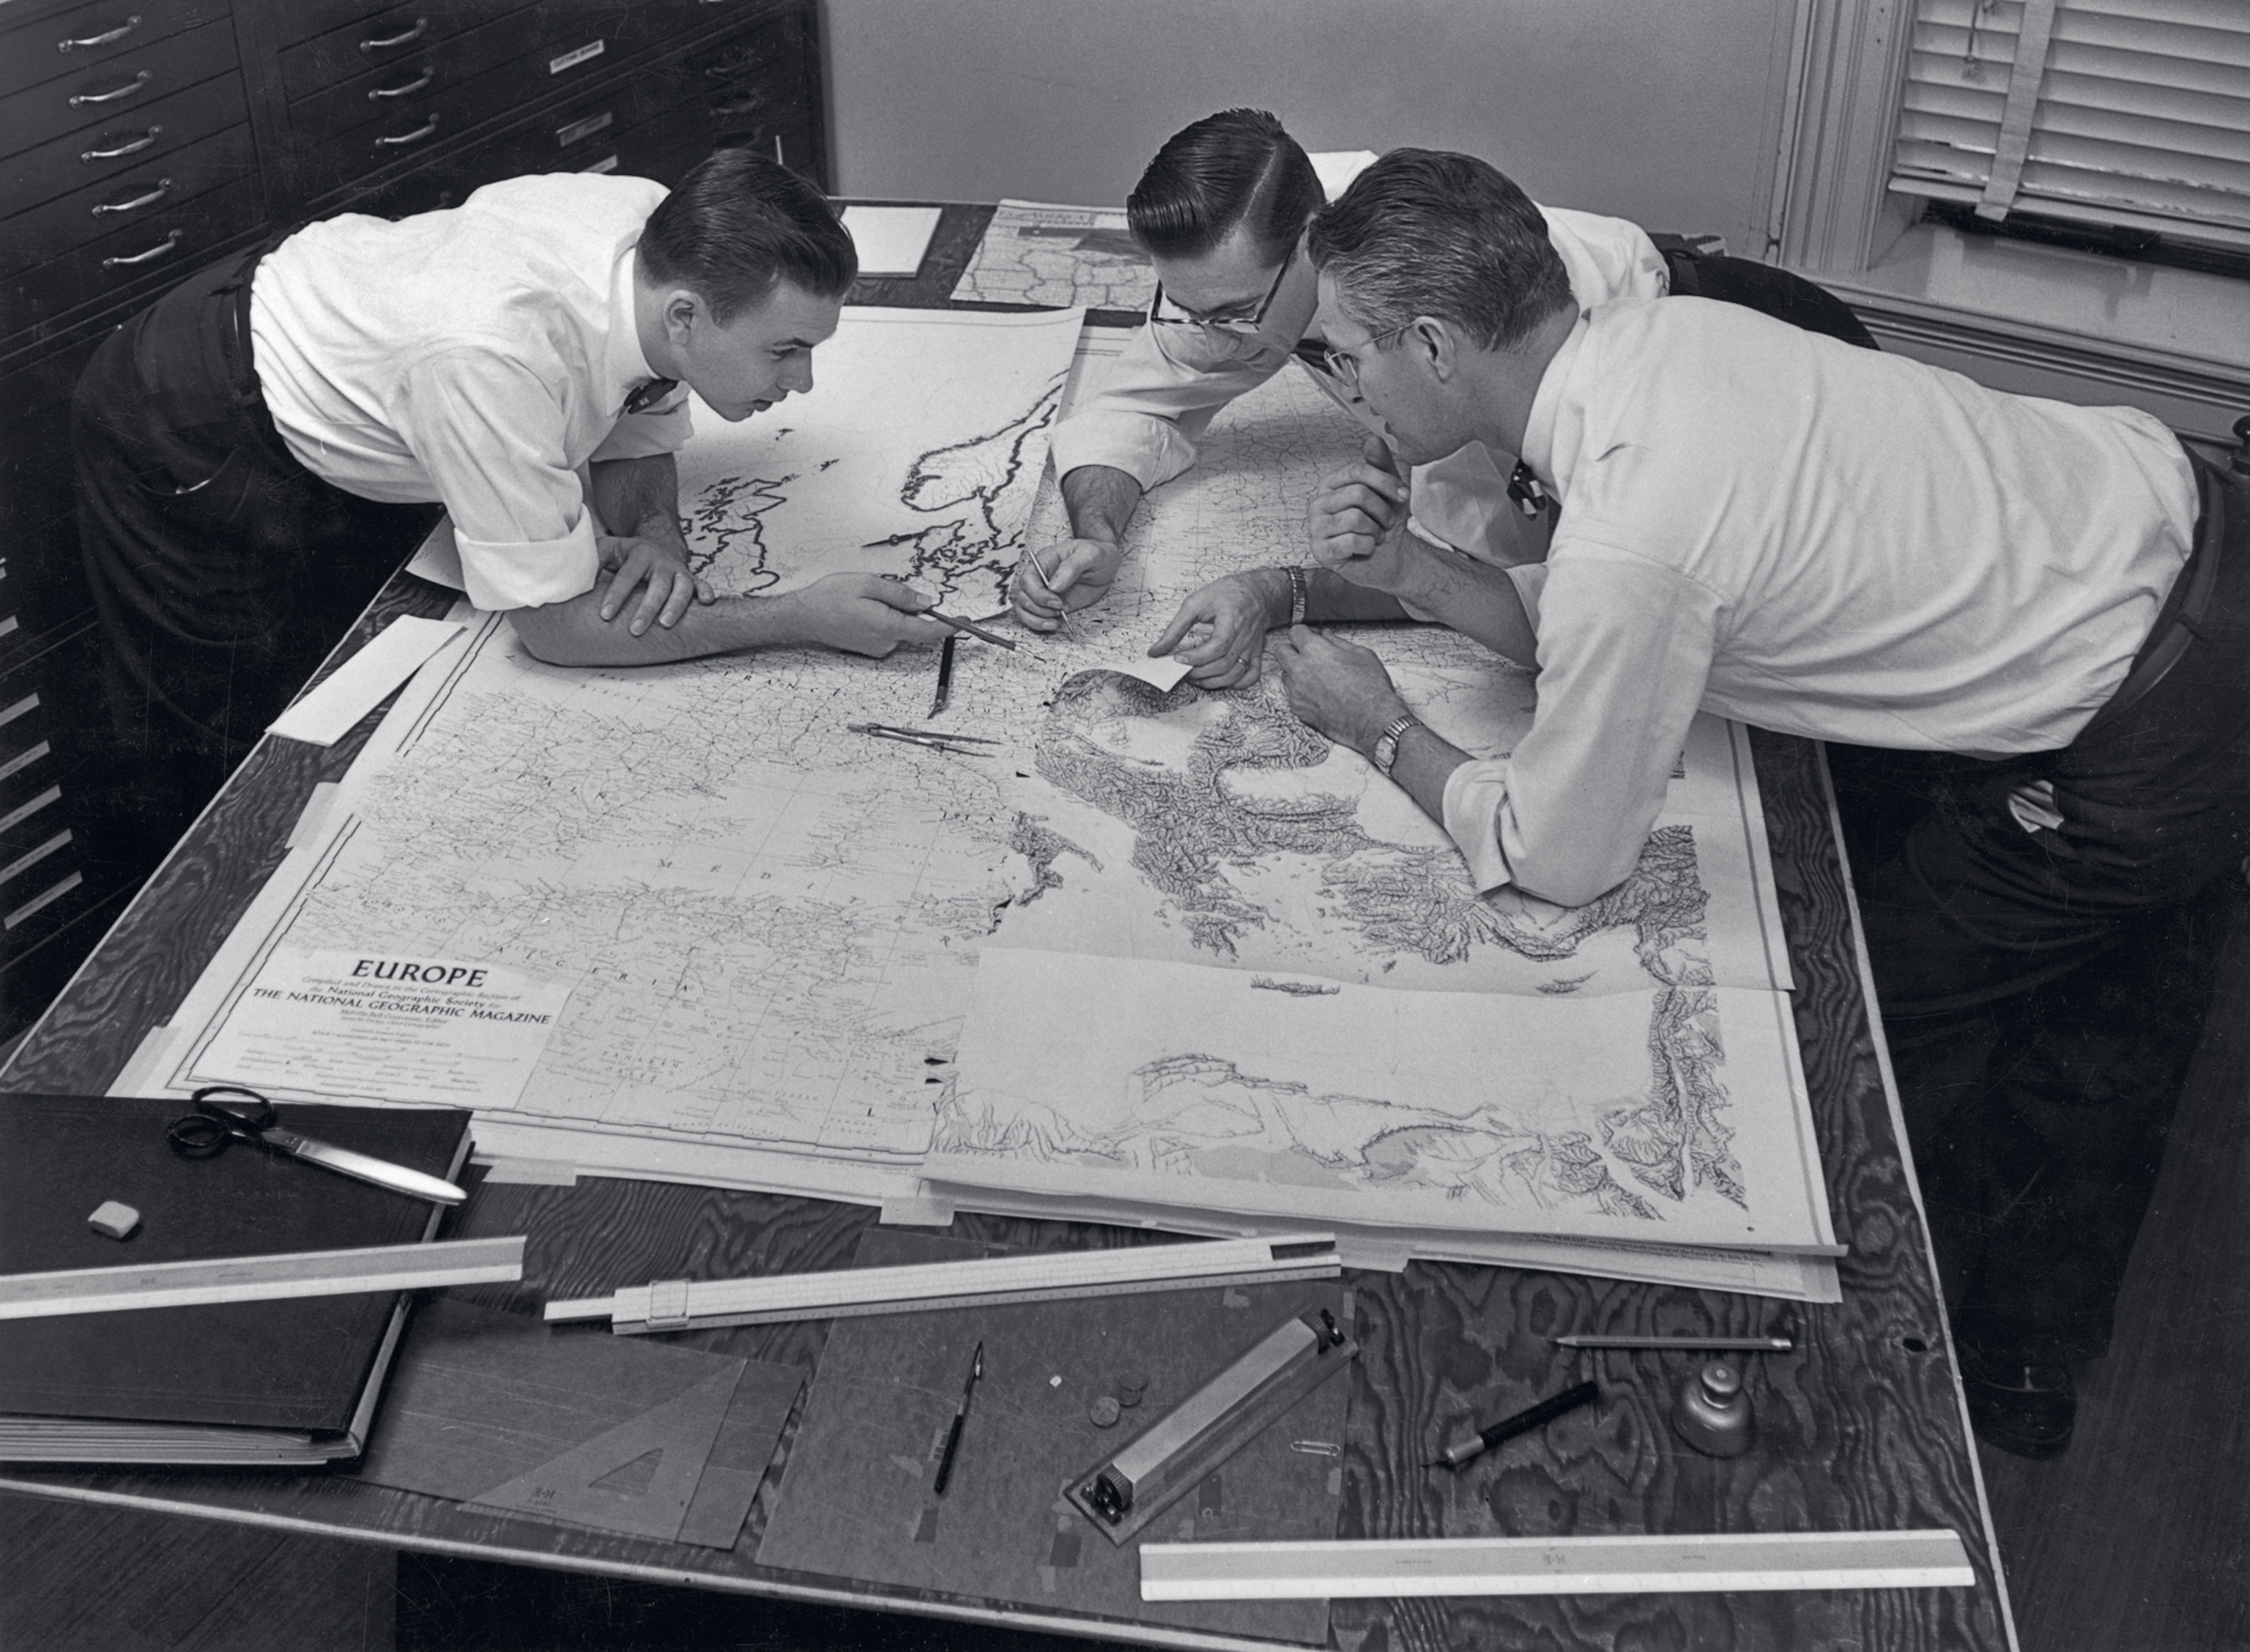
Don Jaeger, Robert Ellis, and Charles Stern (left to right) proofread a map in 1957, when much of the work was done by hand.

Photograph by Bates Littlehales, National Geographic

100 Years of National Geographic Maps: The Art and Science of Where

Since 1915, National Geographic cartographers have charted earth, seas, and skies in maps capable of evoking dreams.

January 23, 2015
7 min read

The coordinates of the office of The Geographer of the National Geographic Society are 38° 54' 18" N, 77° 2' 12" W. You might say that Juan José Valdés, who currently holds that title, knows exactly where he stands.

But the scope of National Geographic's cartographic department, which celebrates its hundredth anniversary this year, encompasses not just those bearings, but also those of every mountain, river, lake, road, reef, fjord, island, inlet, glacier, ocean, planet, galaxy, and solar system—in short, any physical feature on land, on sea, or in space.

At this writing (the count is obsolete as soon as it is tallied), National Geographic cartographers have produced 438 supplement maps, ten world atlases, dozens of globes, about 3,000 maps for the magazine, and many maps in digital form.
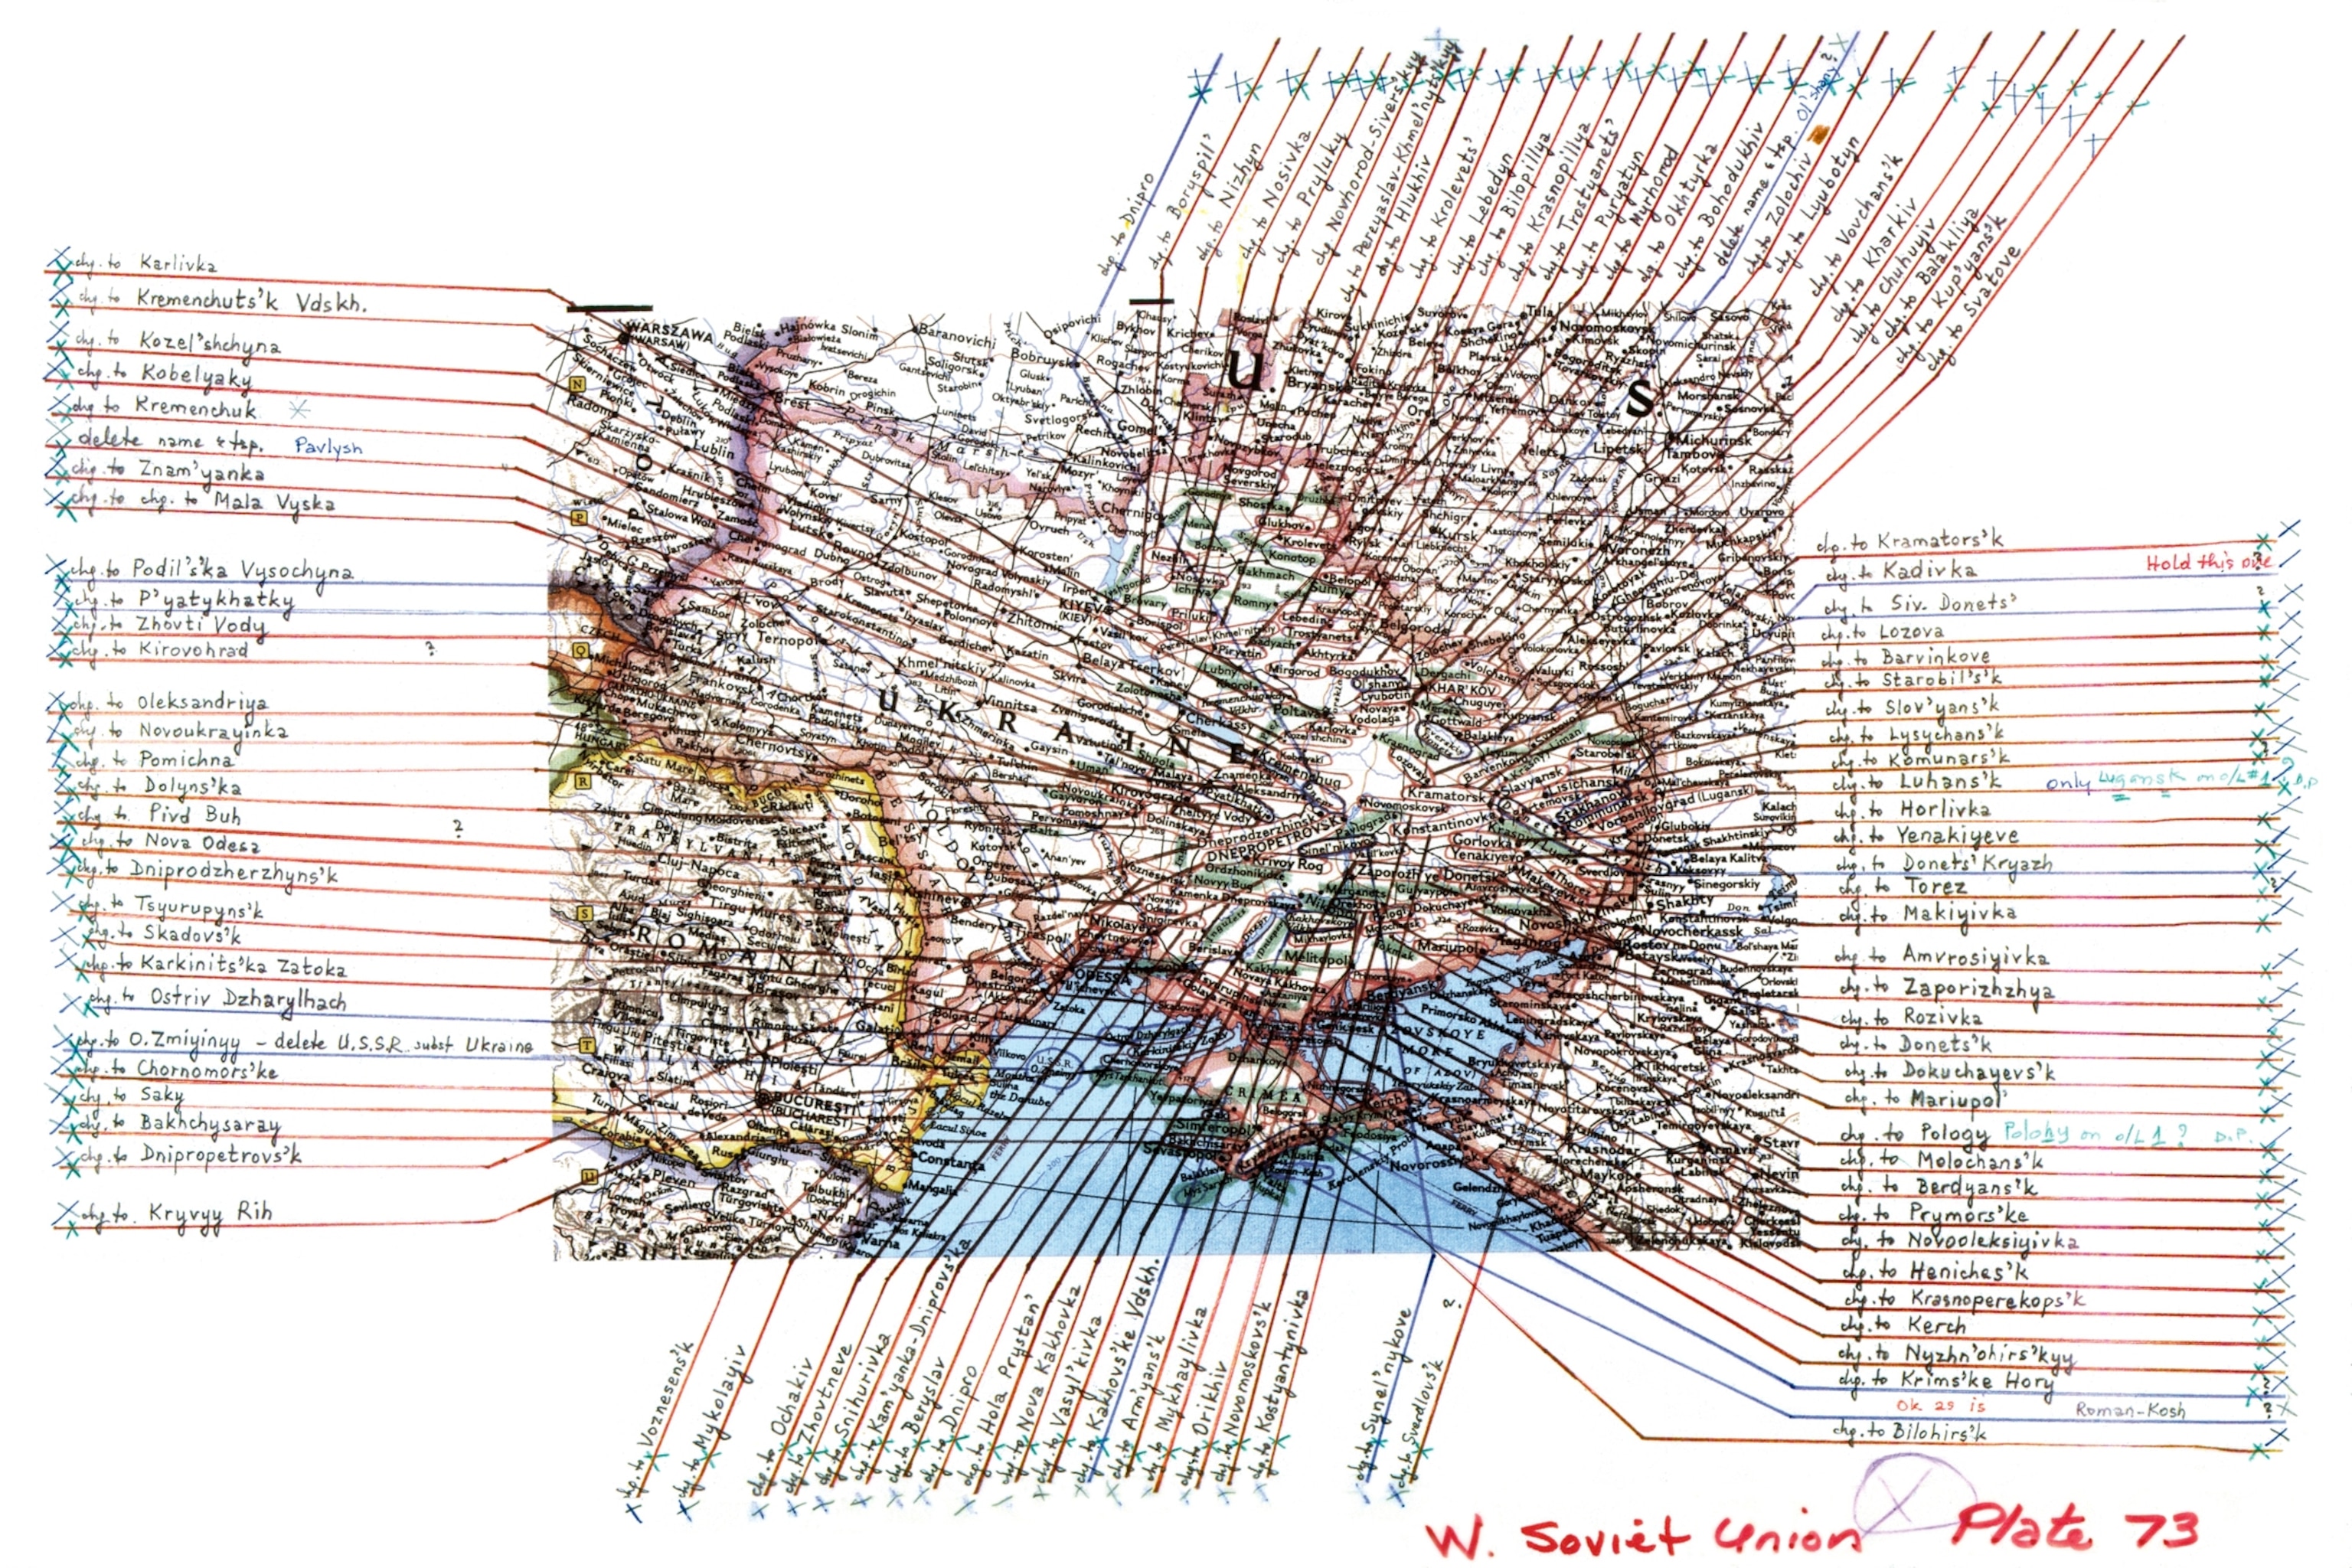
a map with markings showing what place names need to be changed

"The reality of the cartographer is the fickleness of boundaries," says Juan José Valdés, The Geographer of the National Geographic Society. The dissolution of the Soviet Union in 1991 meant that 90 percent of Ukraine's place names had to be changed.

NGS Maps
Map of Europe and the Balkan States

In August 1914, National Geographic magazine published a map of Europe and the Balkan States, subsequently to be the scene of one of the bloodiest conflicts in history—World War I. Editor in Chief Gilbert H. Grosvenor sensed the looming conflict and had the maps printed, stored in the basement, and ready to go.

NGS Maps
Map of the Pacific war theater

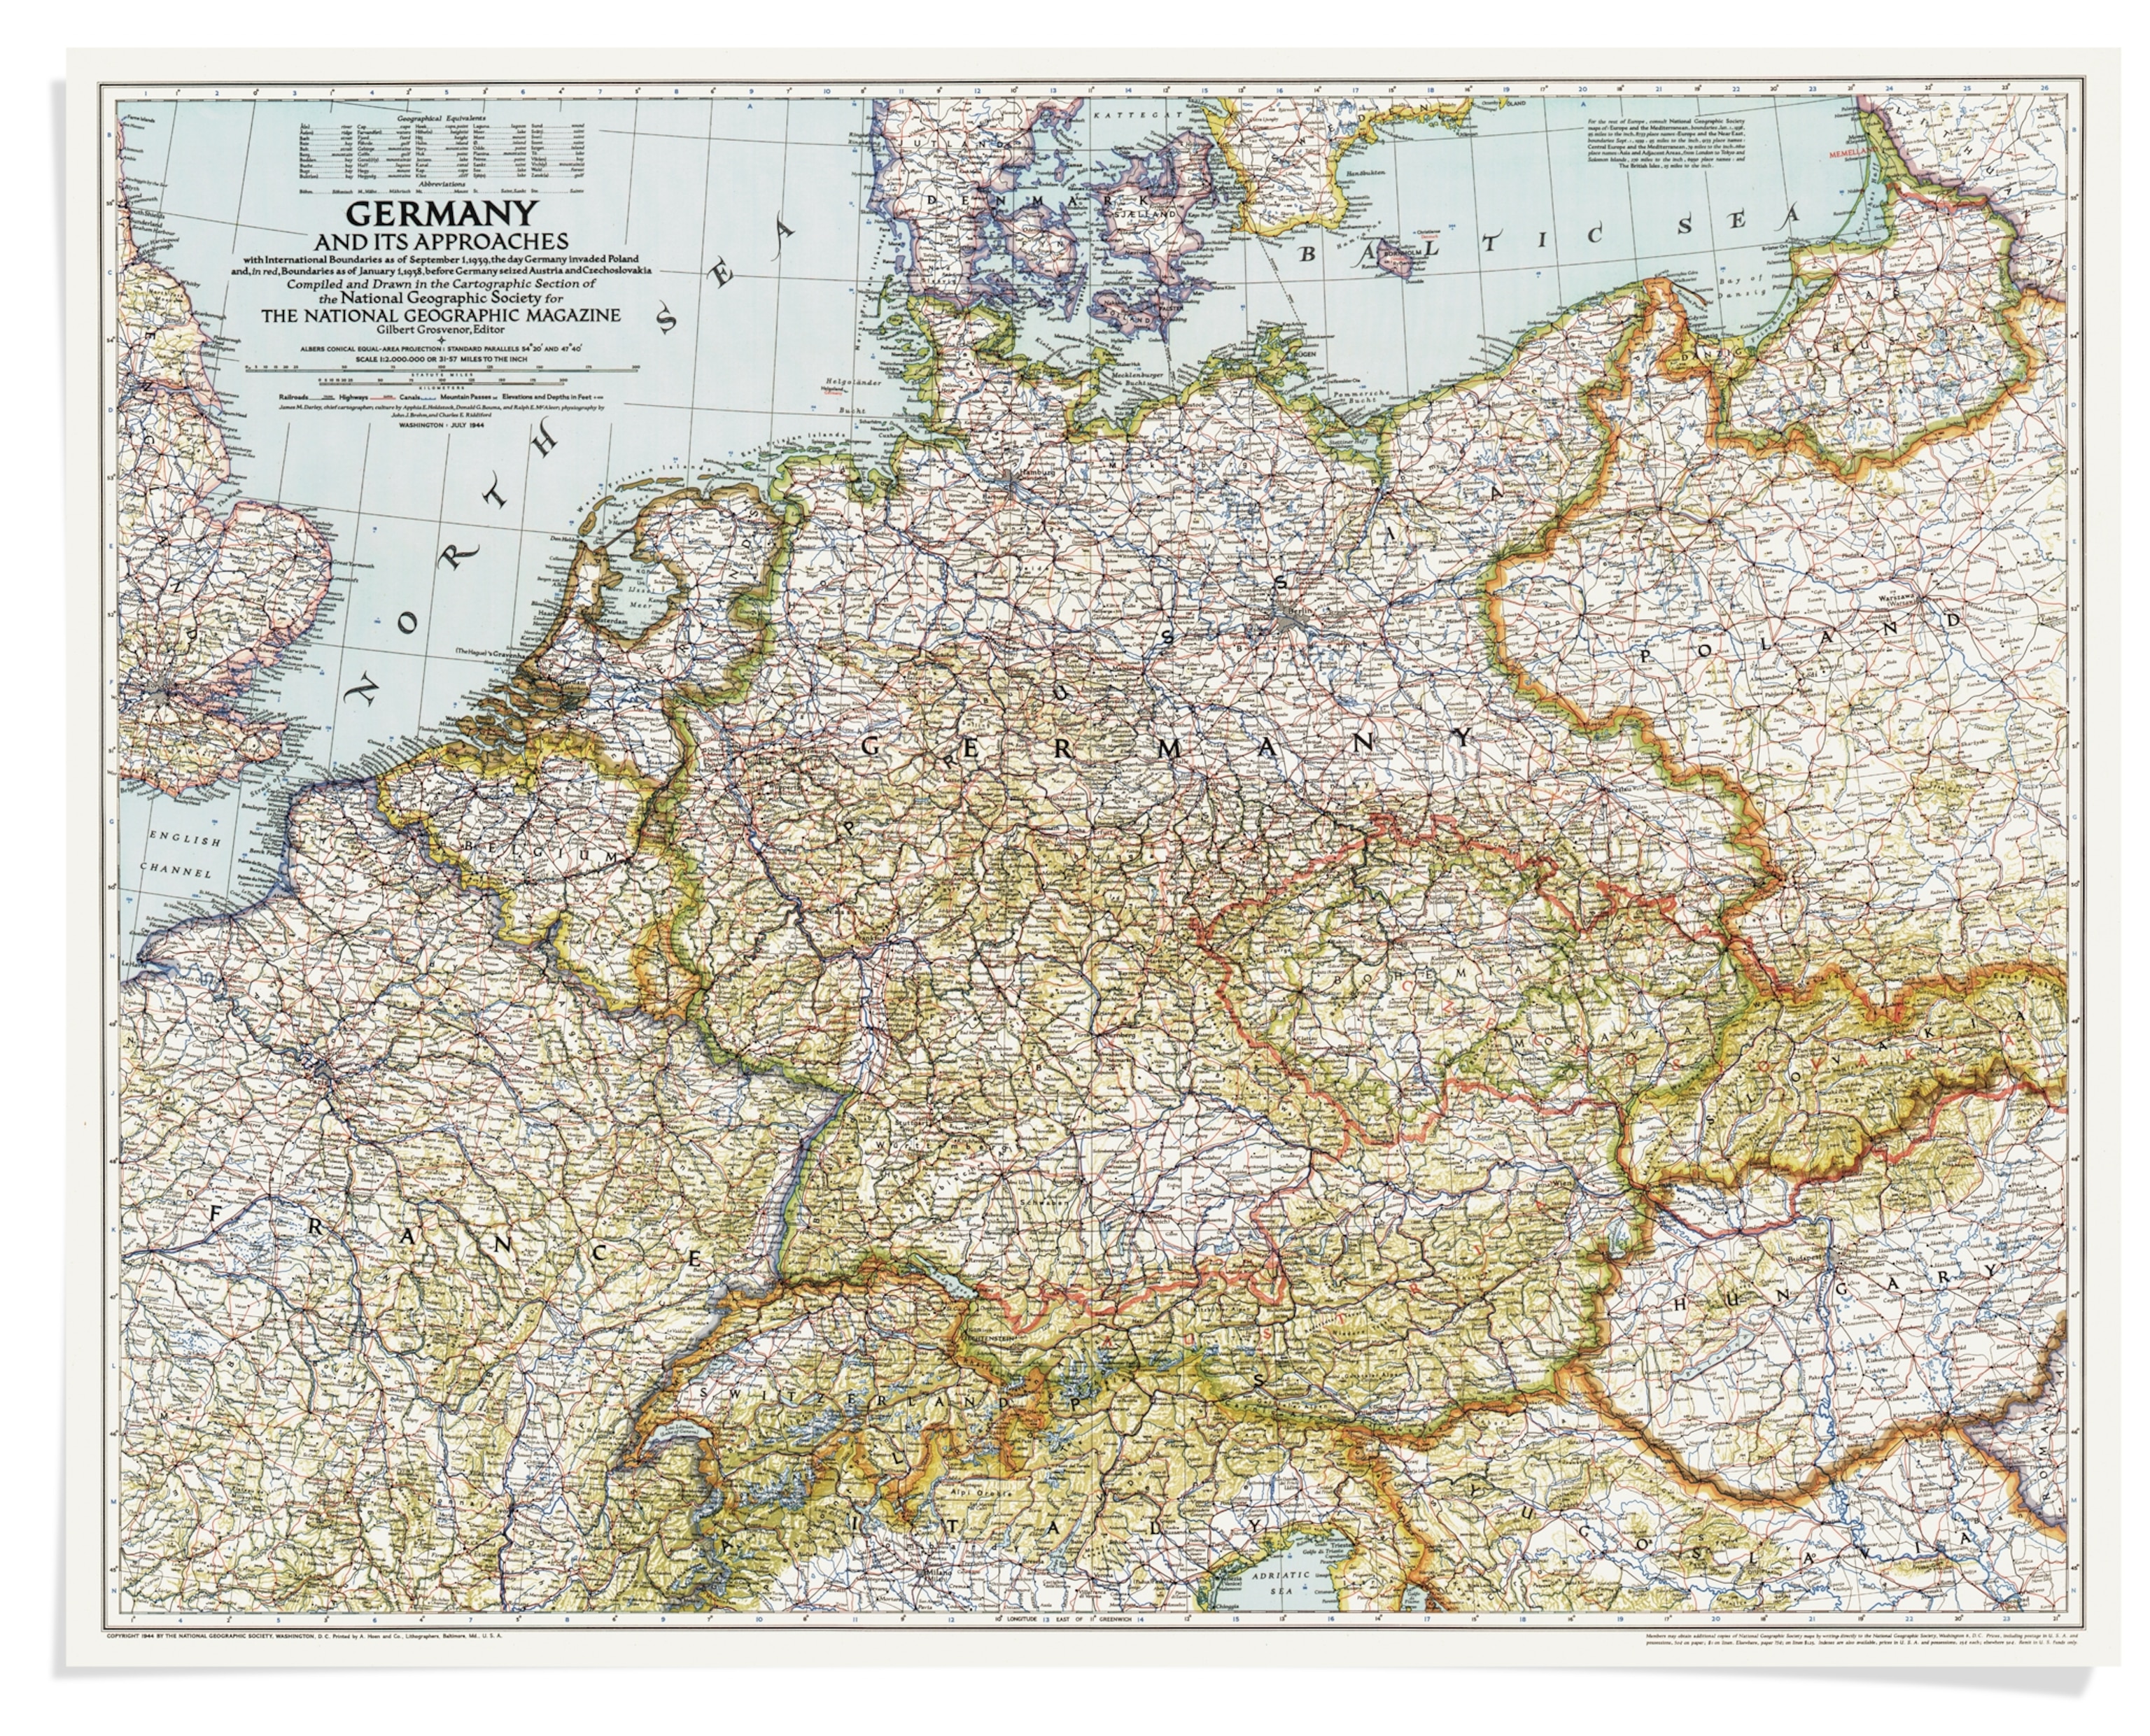
Our maps haven't just chronicled history; they've made it. General Dwight D. Eisenhower carried our map of Germany during his 1945 offensive. When a B-17 carrying Admiral Chester Nimitz got lost in a rainstorm, the pilot landed safely using the Society's map of the Pacific war theater. The map, Nimitz later wrote Gilbert H. Grosvenor, "lent an unexpected but most welcome helping hand."

NGS Maps

What distinguishes a National Geographic map? Accuracy and attention to detail, certainly. The 1969 map of the moon pinpointed the landing sites of all but one of the 23 unmanned spacecraft that had touched down on the lunar surface (the crash site of the Orbiter 4 was unknown).

But the hallmark of the division, founded by the magazine's first full-time editor, Gilbert H. Grosvenor, is and always will be innovation. The first chief cartographer, Albert H. Bumstead (chief, 1915-1939), set the pace by inventing a sun compass used by Richard E. Byrd on his 1926 flight to the North Pole (magnetic compasses are not polar friendly), as well as the eponymous Bumstead photocomposing machine, which replaced labor-intensive hand-lettering with photographically reproduced type.
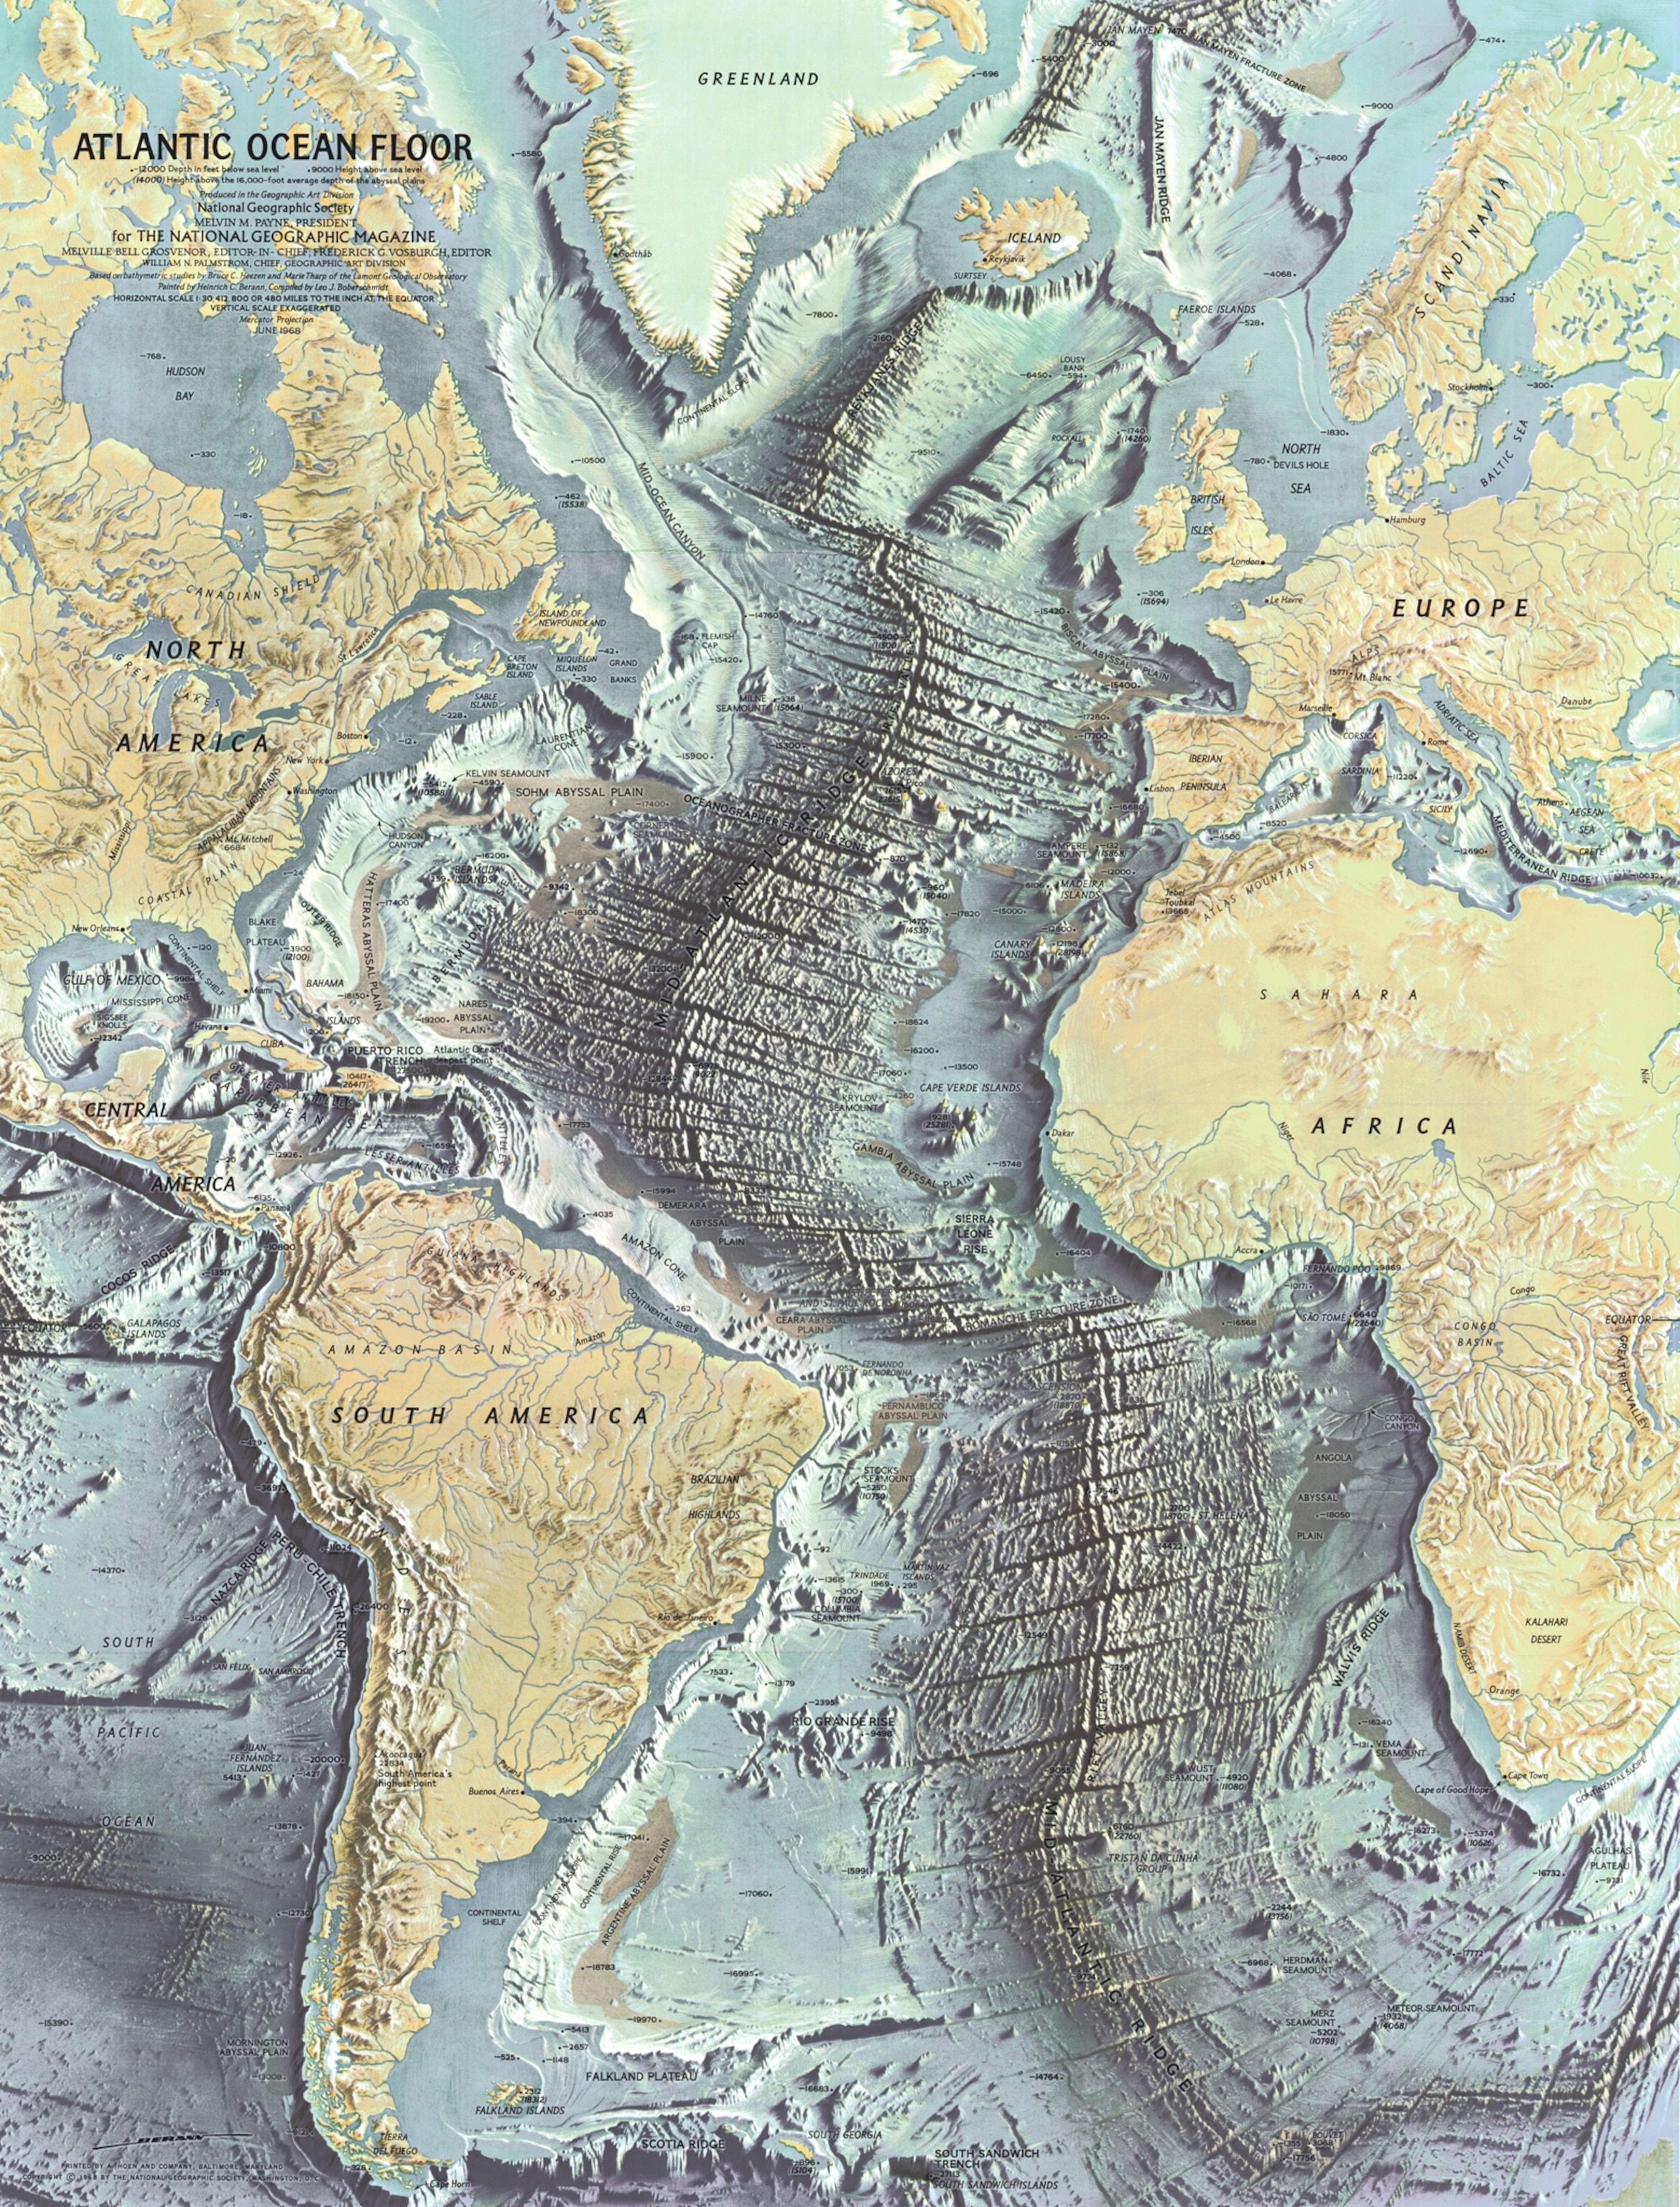
Map of the ocean floor

Based on the work of geophysicists Bruce Heezen and Marie Tharp, this 1968 map of the ocean floor helped bring the concept of plate tectonics to a wide audience. Tharp began plotting the depths in 1950 from soundings taken by ships in the Atlantic, but, as a woman, wasn't allowed on the ships herself. In 1978 she was awarded the Society's Hubbard Medal for her pioneering research.

NGS Maps
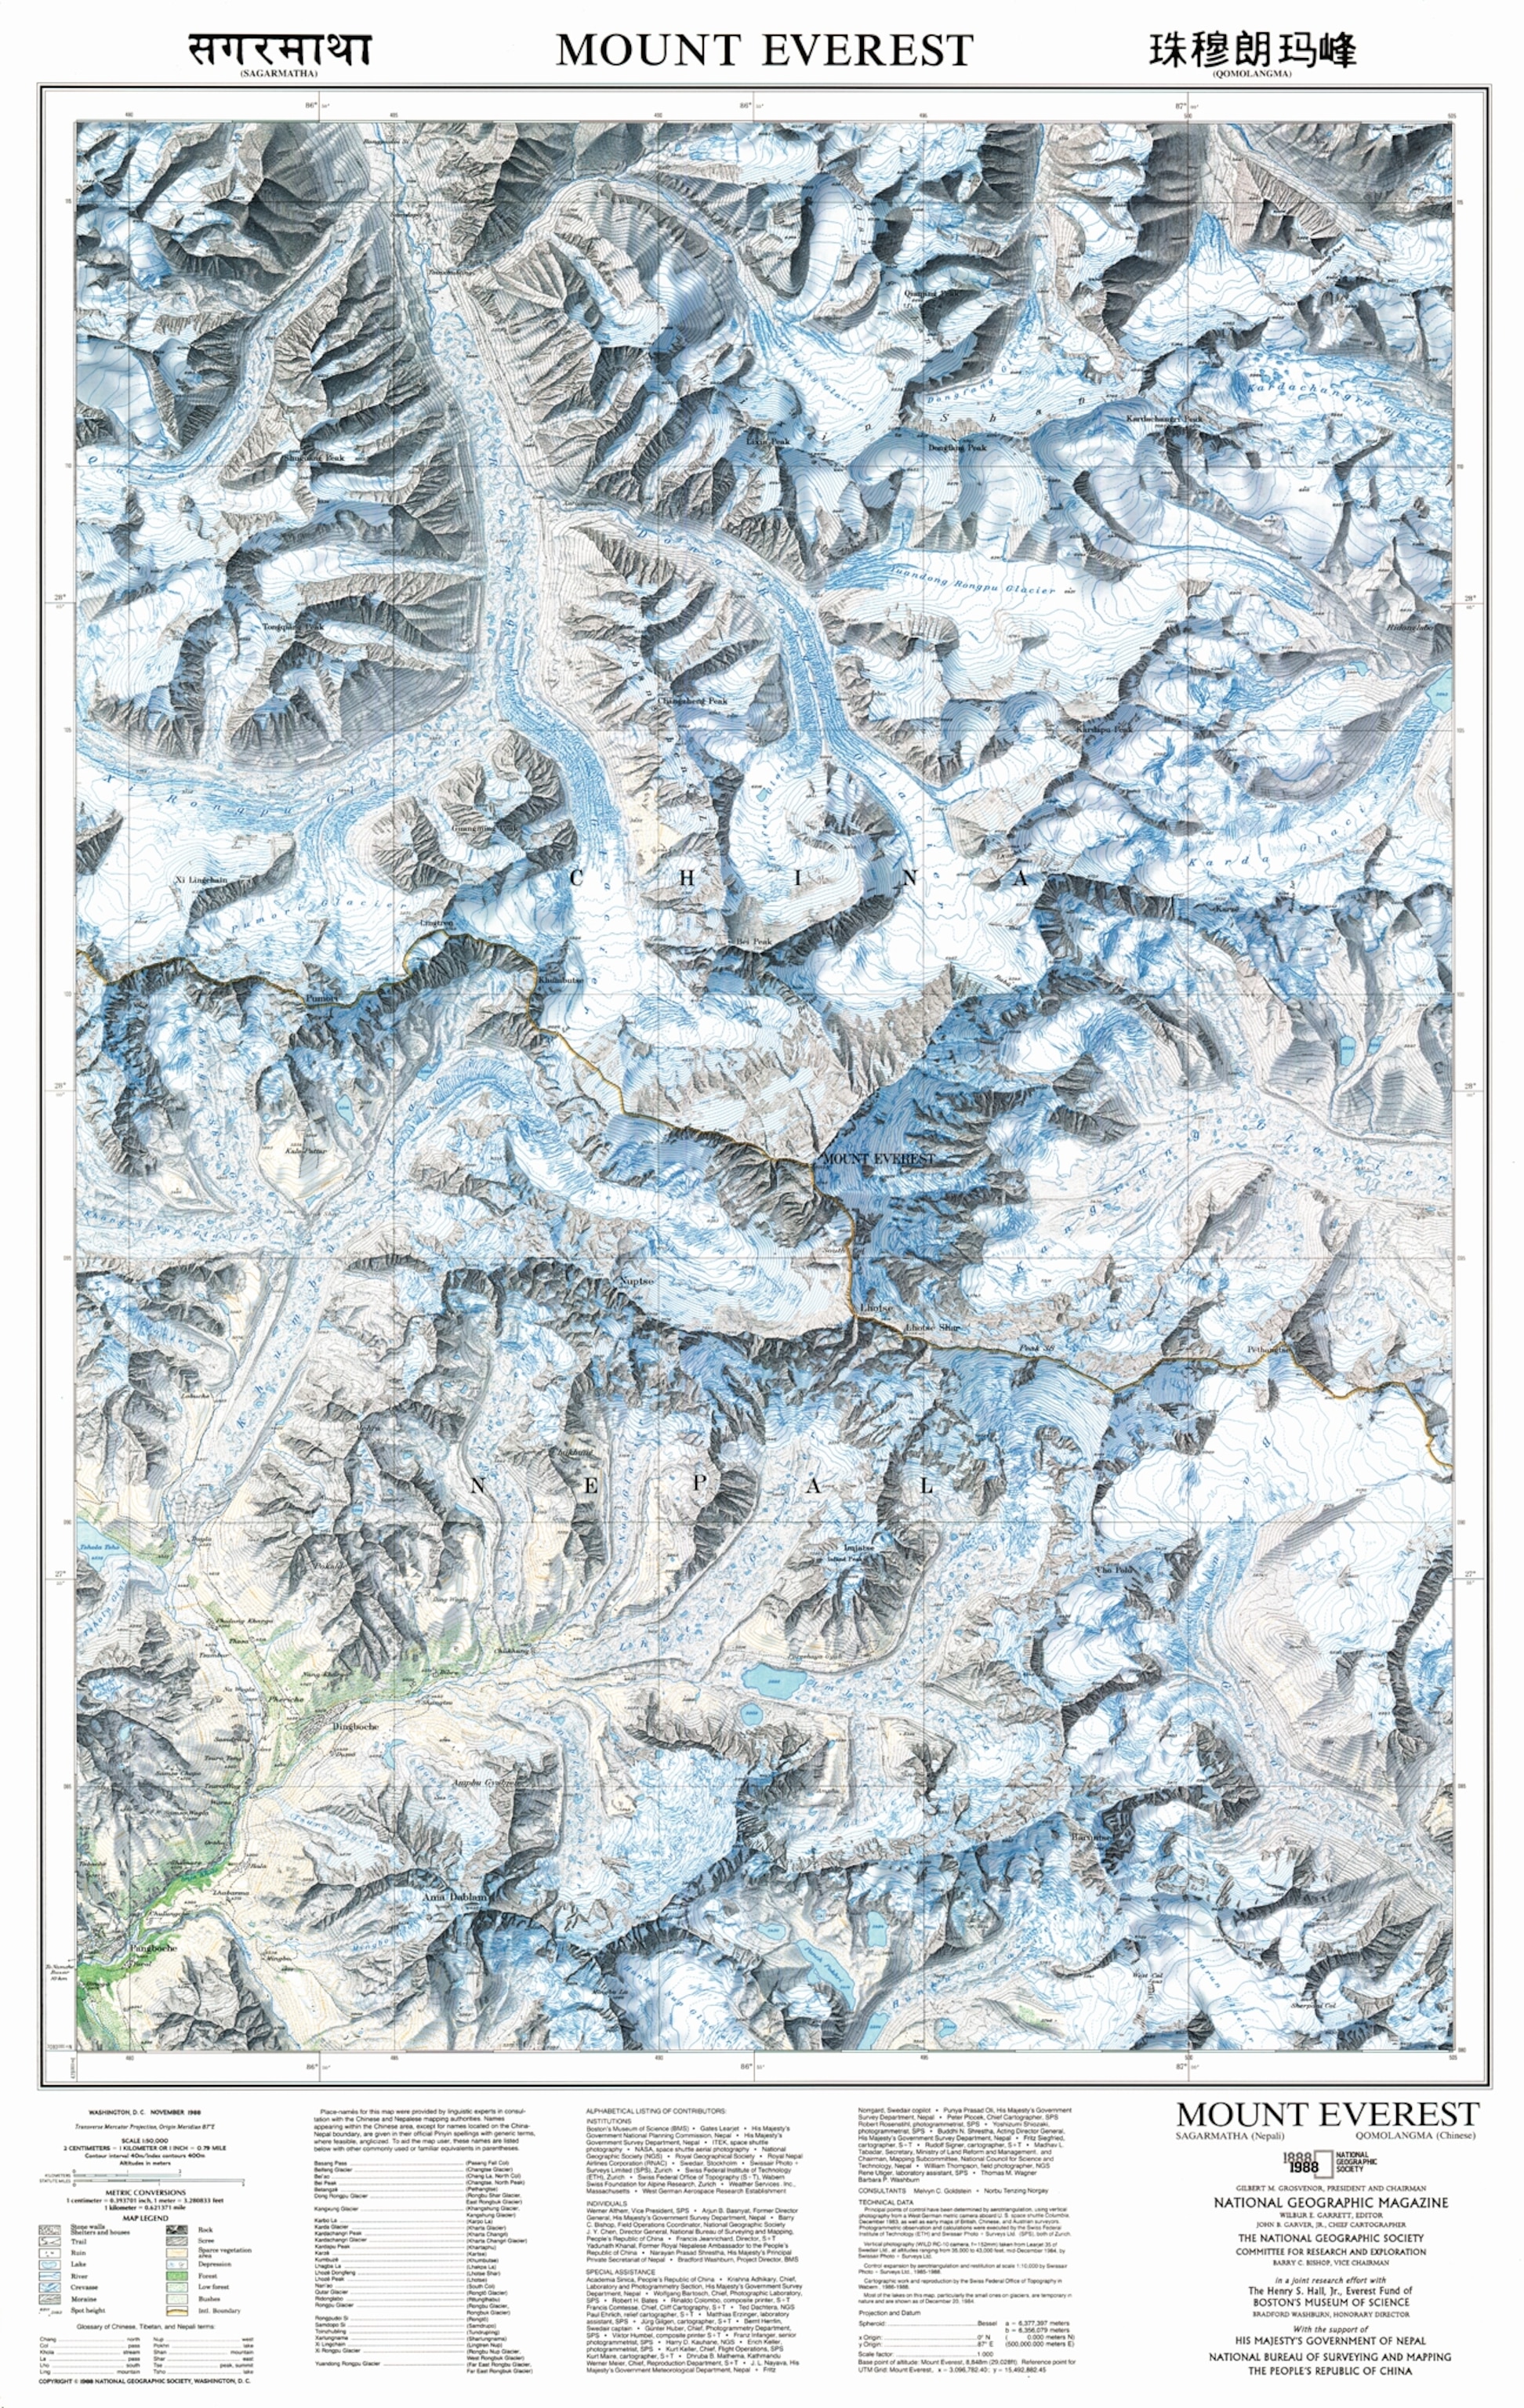
Map of Mount Everest

The November 1988 map of Mount Everest, which took four years to produce, relied on a high-resolution camera carried on the Columbia space shuttle and 160 overlapping aerial images taken from a Learjet flying at 40,000 feet to map 380 square miles of the region.

NGS Maps

To ensure readability, Charles E. Riddiford, a staff cartographer from 1923 to 1959, designed elegant map type fonts that were patented by the Society and are still in use today.

In 1957 the division contributed its inventiveness to the space program with a small, handheld satellite tracker. The creator of that device, Wellman Chamberlin, also dreamed up the geometer, a kind of plastic "thinking cap" that allowed distance to be measured on a globe.

As the pace of the world accelerated, so did the pace of cartography. John B. Garver (chief, 1982-1991) presided over the installation of a Scitex computer system so large it required its own climate-controlled room; it enhanced accuracy and streamlined the map production process. Allen Carroll (chief, 1998-2010) launched the National Geographic MapMachine, NGS's first interactive atlas on the Internet, in 1999.
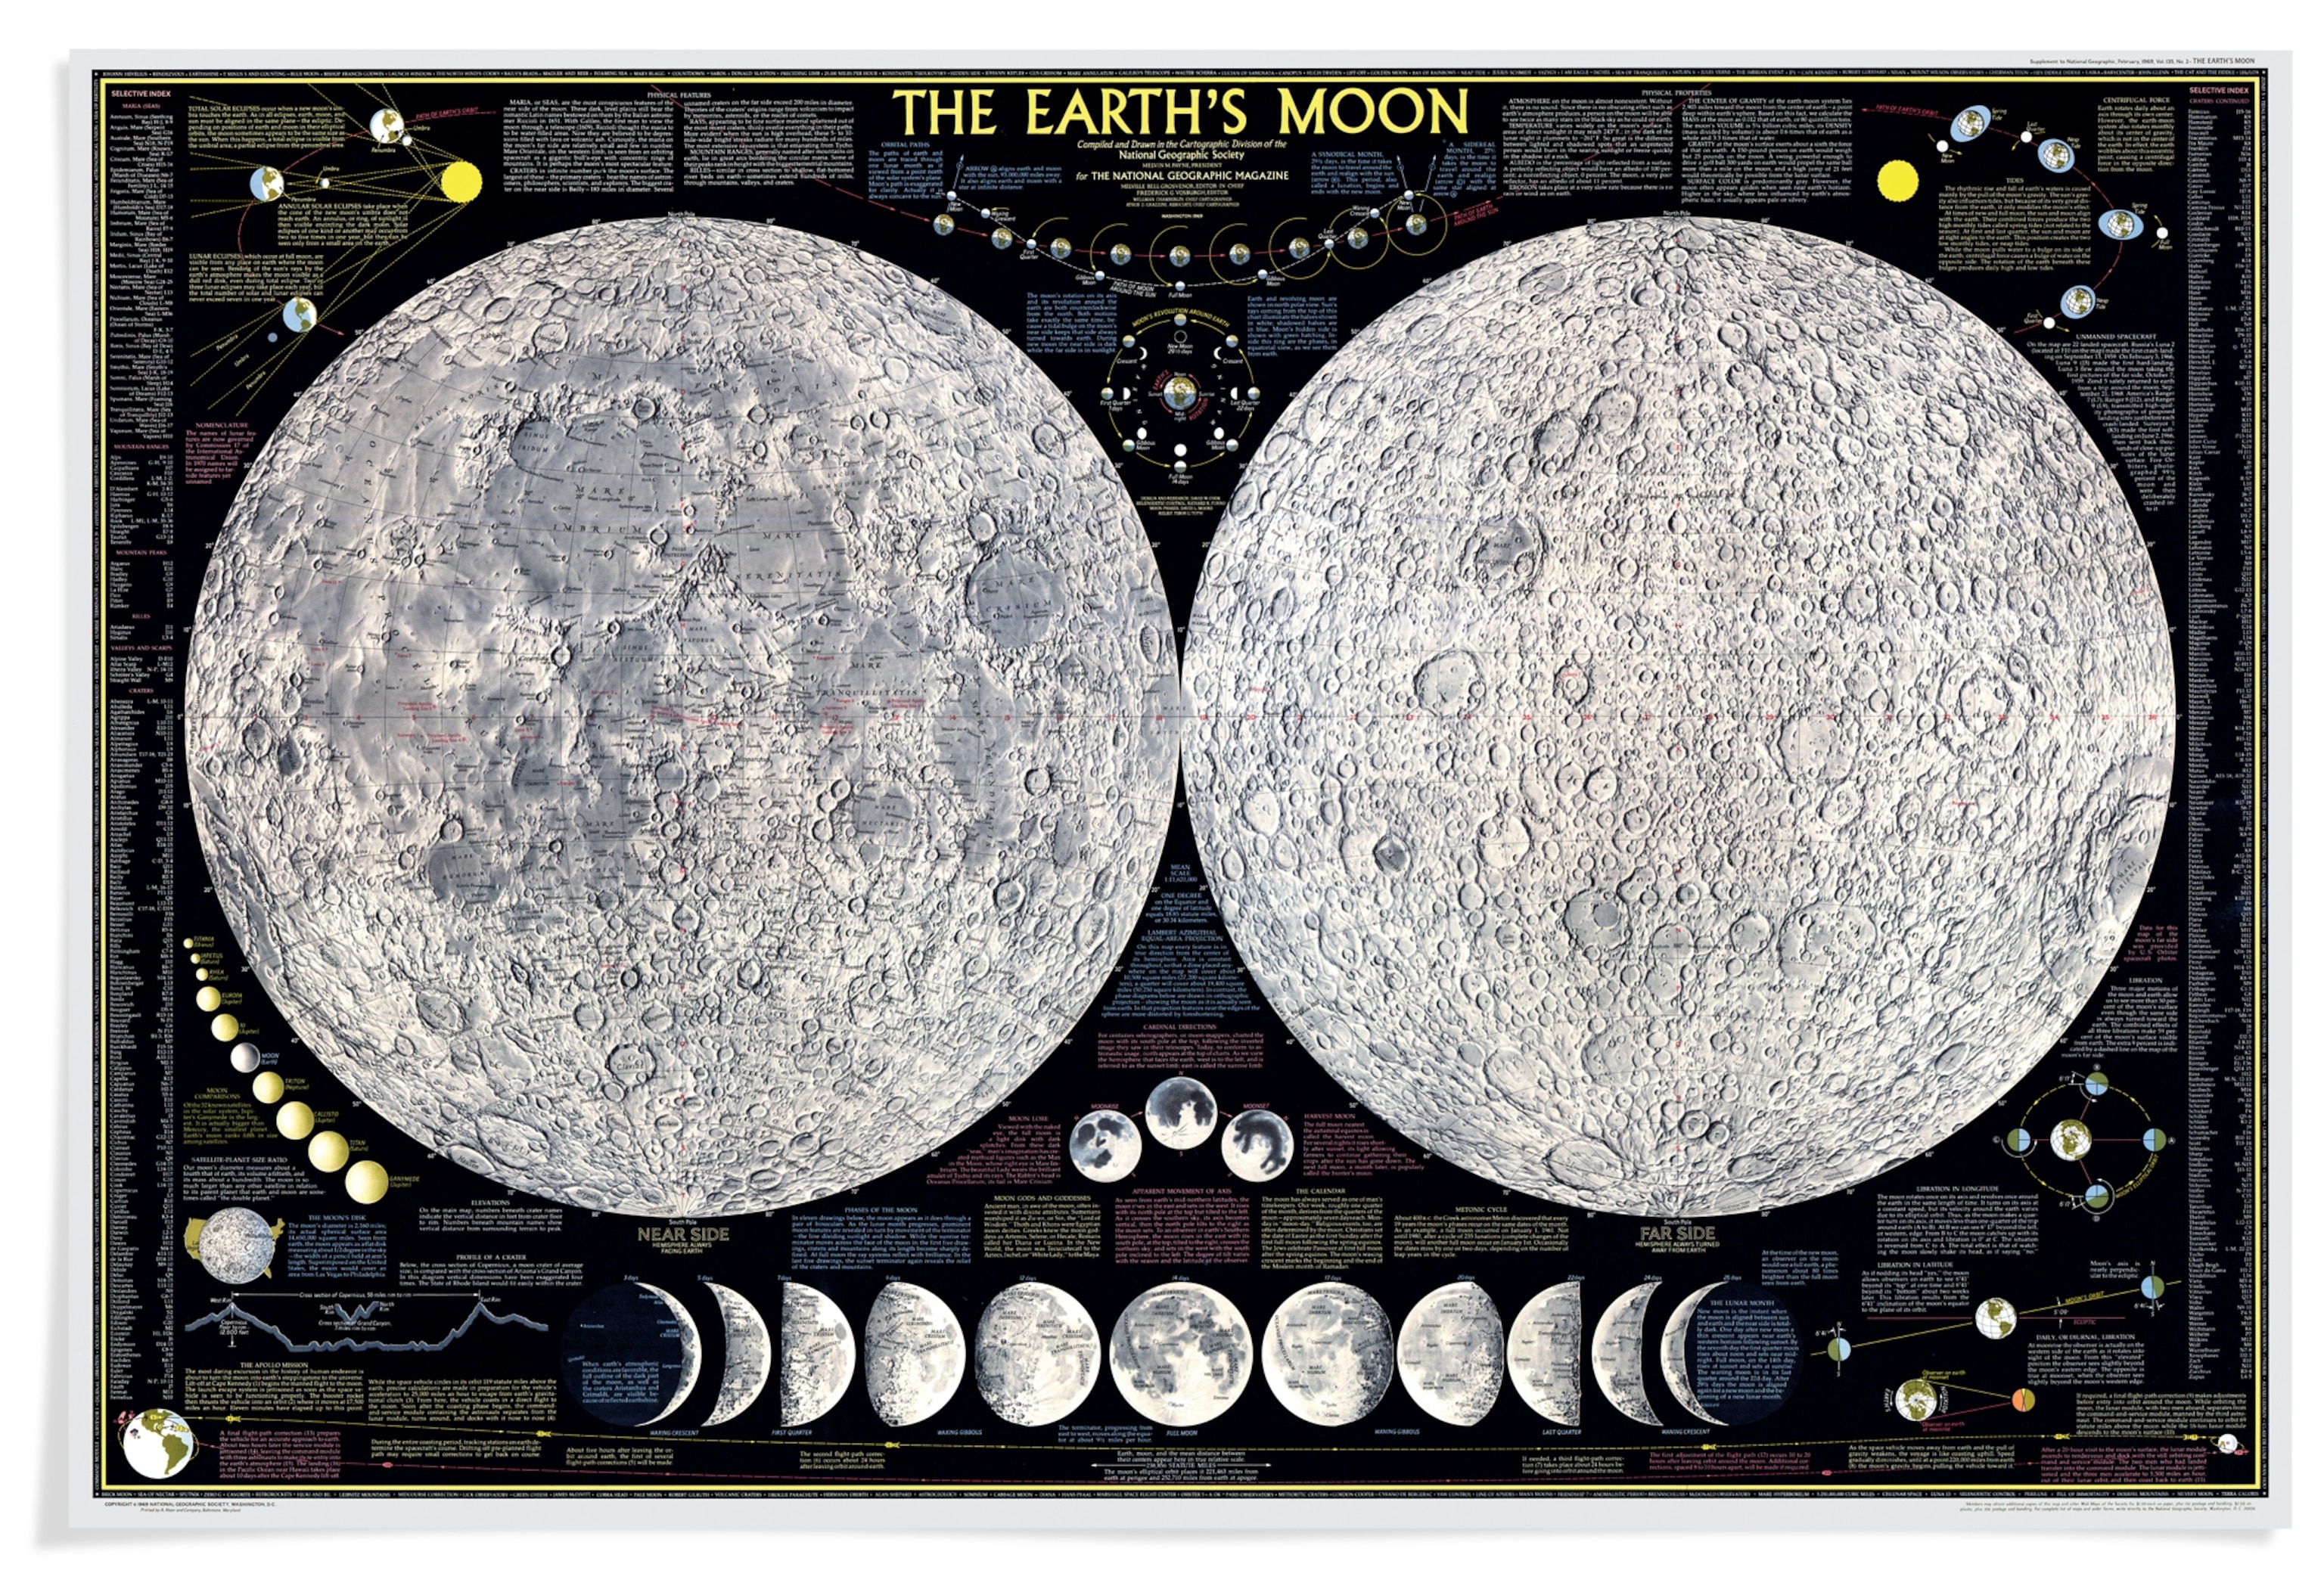
Map of the moon

A work of unearthly beauty, this 1969 map of the moon was the first ever to show both faces of the lunar surface on a single sheet—not just the familiar surface we see at night, but the hidden far side as well. Cartographic artist Tibor Toth, who delicately shaded the surface crater by crater, spent several weeks at the Lowell Observatory in Flagstaff, Arizona, to scope out his subject.

NGS Maps
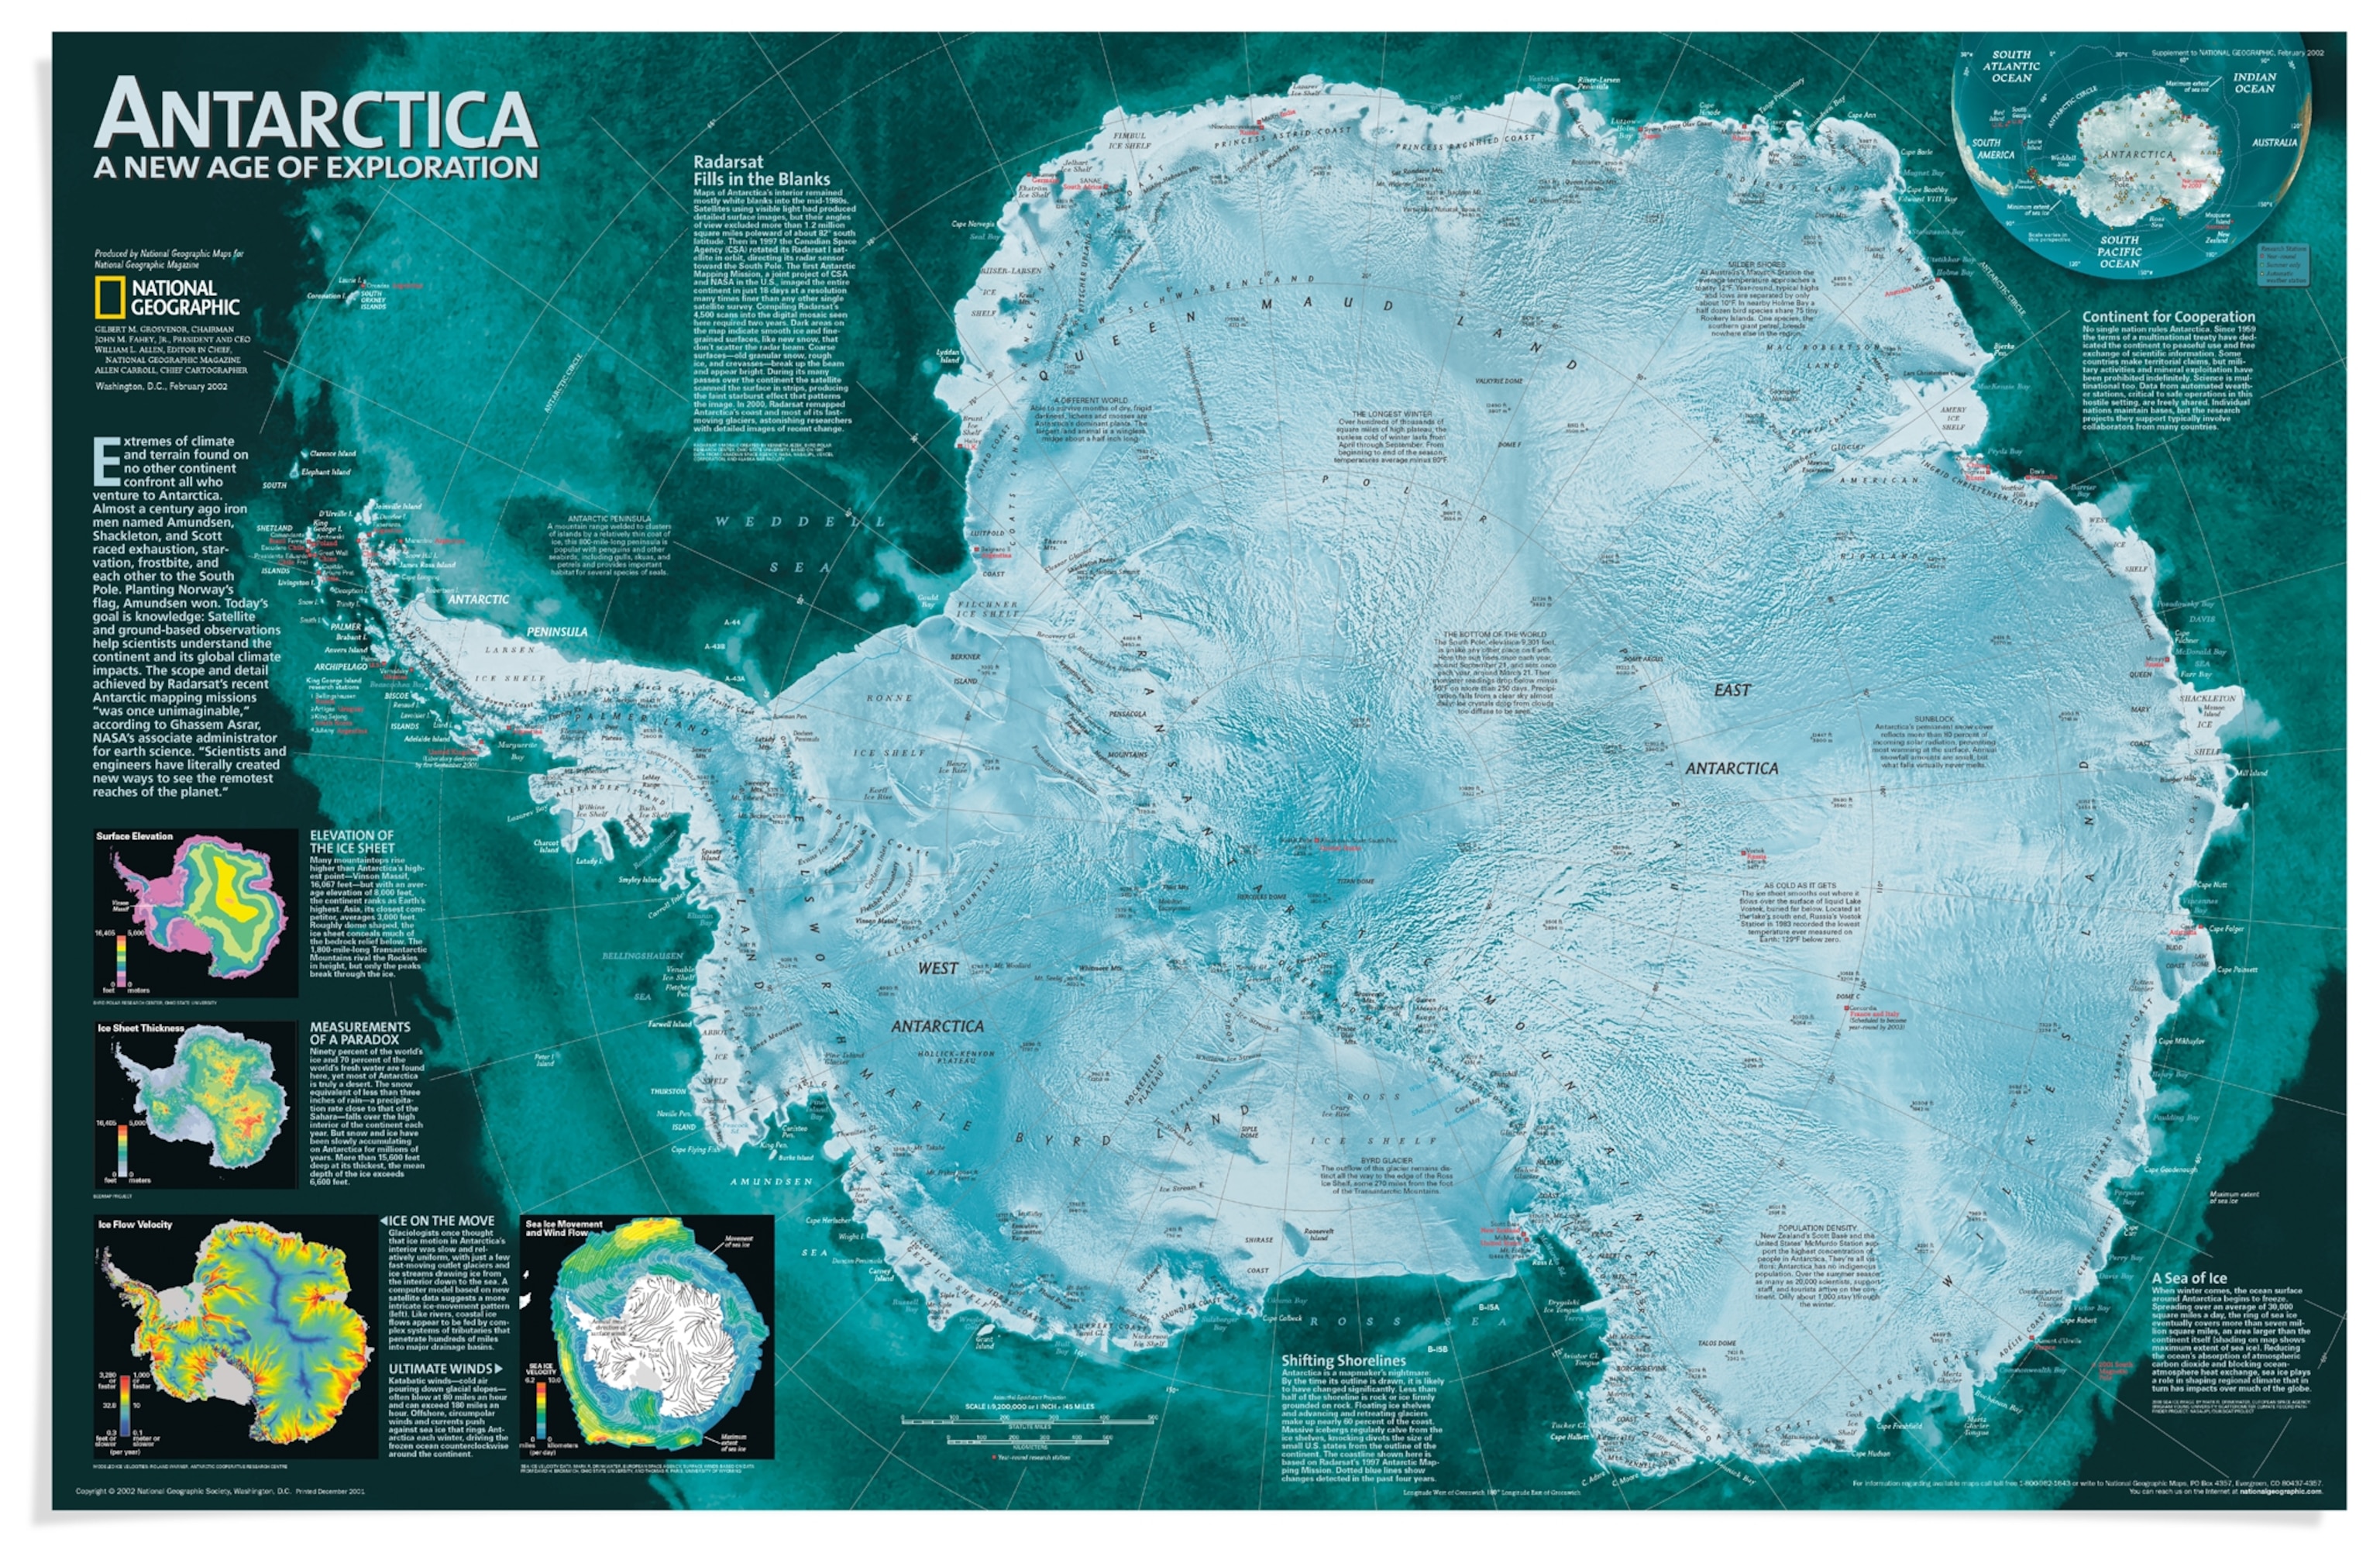
Map of Antarctica

In the early 1900s Roald Amundsen, Ernest Shackleton, and Robert Falcon Scott raced each other to the South Pole. A February 2002 map of the area included surface elevation, ice sheet thickness, and ice flow velocity, as well as the location of the many research bases and automated weather stations. The text notes: "Antarctica is a mapmaker's nightmare: By the time it is drawn, it is likely to have changed significantly."

NGS Maps

In the past, a map would take months to produce. In the fast-forward digital age, turnaround time for some maps that run on National Geographic's website can be a matter of hours, but accuracy still matters.

What's ahead as the division turns the corner to its next hundred years?

"Crowdsourced cartography will help people find and map more objects," Valdés says. "As more devices are connected to the Internet, users will be able to create more personalized maps. Wearable technologies, such as smart watches, will allow an increased capture of geo-data.

"Of course," he adds, "Society cartographers will still be needed to collect and analyze that data."
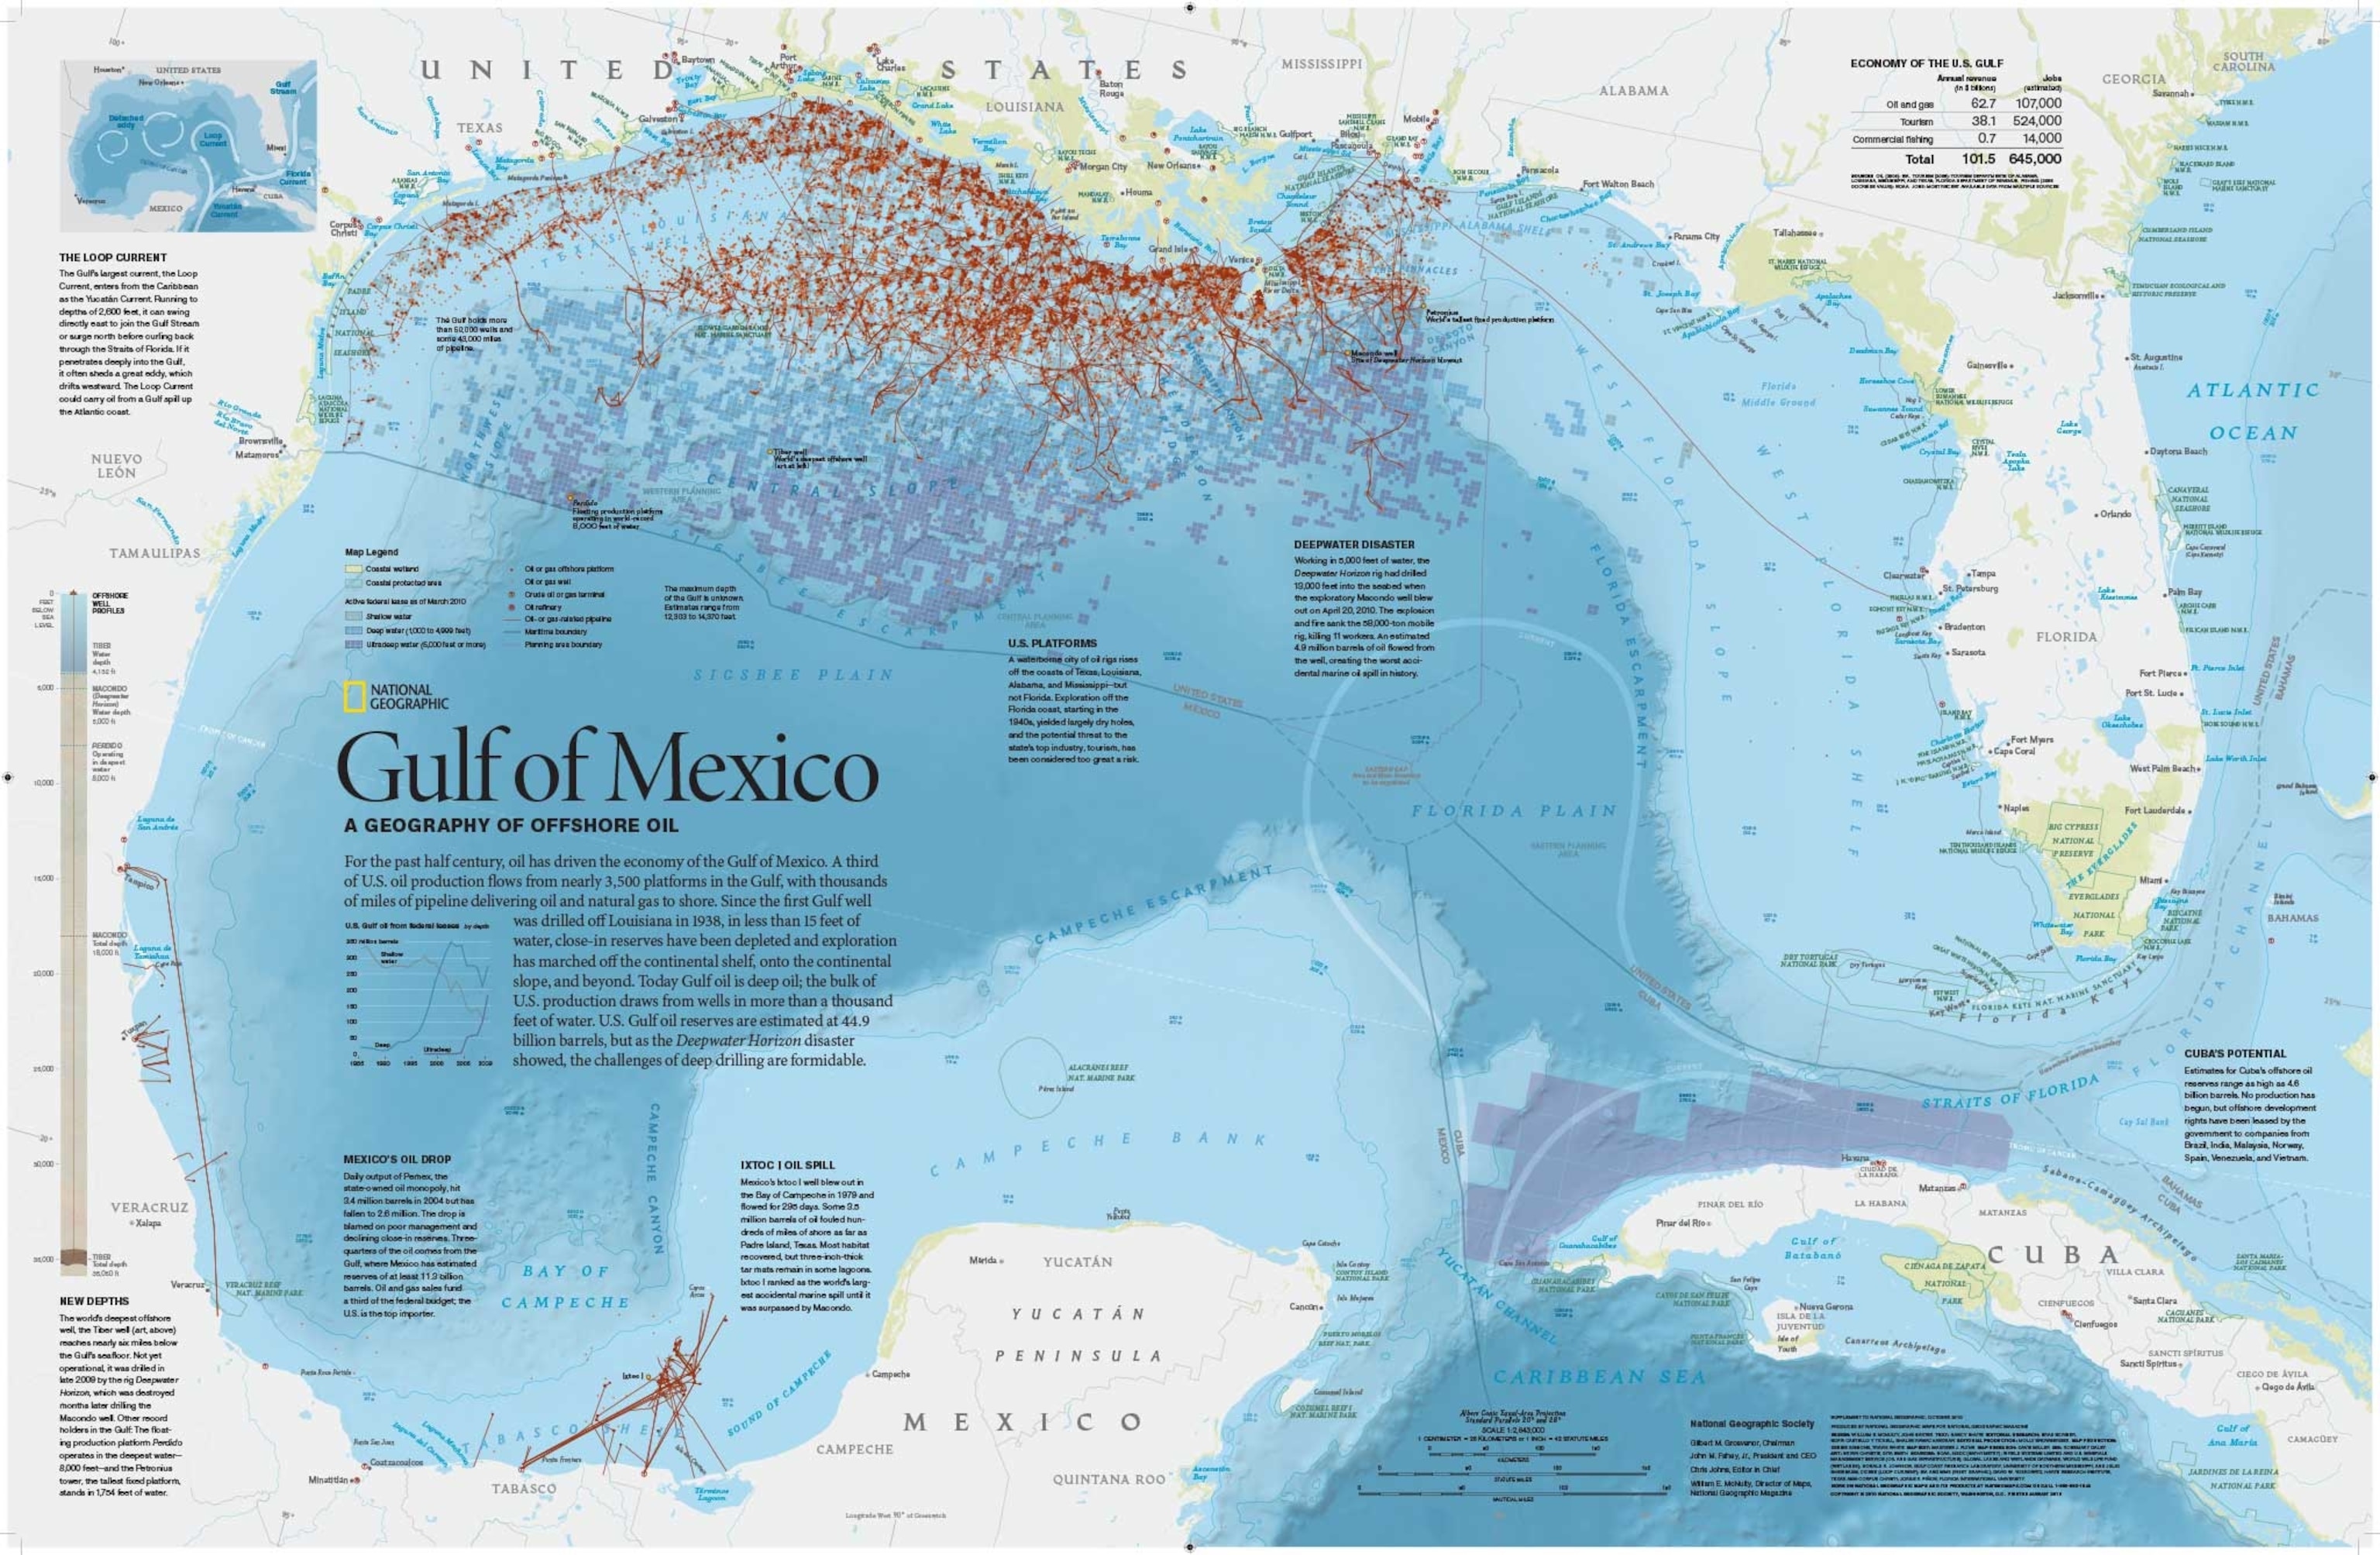
Map of the Deepwater Horizon oil spill in the Gulf of Mexico

After the worst oil spill in history—the April 2010 explosion and sinking of the Deepwater Horizon rig in the Gulf of Mexico—National Geographic created a map of the many oil rigs off the coasts of Texas, Louisiana, Alabama, and Mississippi. The map's opposite side shows where the surface oil spread and depicts the rich marine ecosystem that suffered the consequences of the spill.

NGS Maps

Follow Cathy Newman on Twitter.

LIMITED TIME OFFER

Discover More, Spend Less
With new subscriber-exclusive stories published daily and complete archive access, your opportunities to explore are endless!